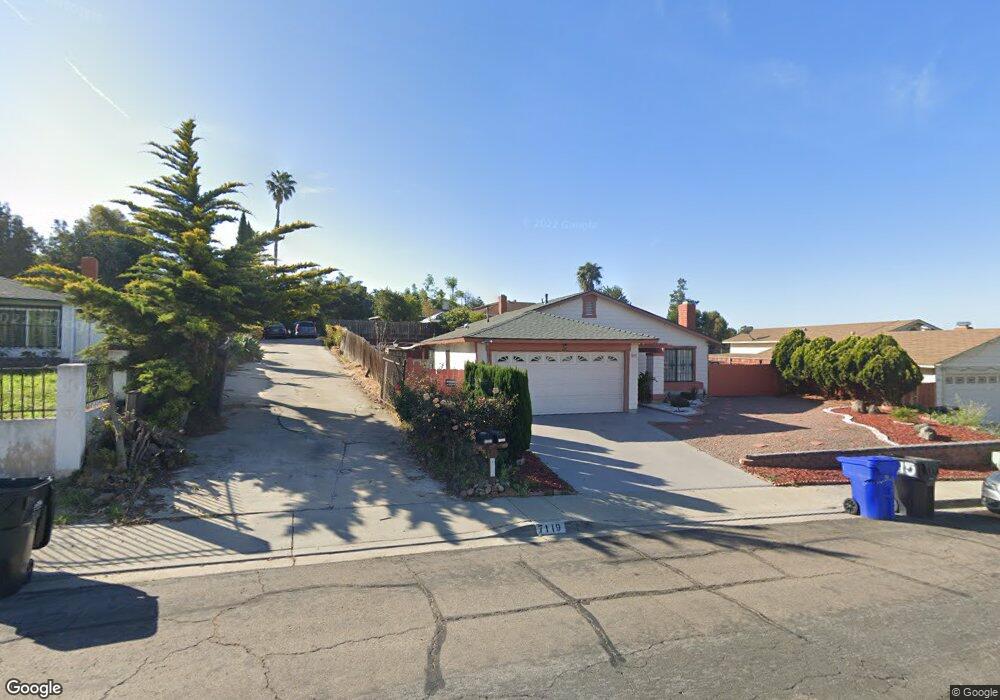
7119 Brookhaven Rd San Diego, CA 92114
Bay Terraces NeighborhoodEstimated Value: $755,000 - $803,645
4
Beds
2
Baths
1,484
Sq Ft
$530/Sq Ft
Est. Value
About This Home
This home is located at 7119 Brookhaven Rd, San Diego, CA 92114 and is currently estimated at $786,661, approximately $530 per square foot. 7119 Brookhaven Rd is a home located in San Diego County with nearby schools including Bethune Middle School, Bell Middle School, and Morse High School.
Ownership History
Date
Name
Owned For
Owner Type
Purchase Details
Closed on
Aug 17, 1998
Sold by
Agas Myrna A
Bought by
Agas Arthur L
Current Estimated Value
Home Financials for this Owner
Home Financials are based on the most recent Mortgage that was taken out on this home.
Original Mortgage
$166,260
Outstanding Balance
$34,715
Interest Rate
6.93%
Mortgage Type
VA
Estimated Equity
$751,946
Purchase Details
Closed on
Jul 28, 1998
Sold by
Nunez Maria E
Bought by
Agas Arthur L
Home Financials for this Owner
Home Financials are based on the most recent Mortgage that was taken out on this home.
Original Mortgage
$166,260
Outstanding Balance
$34,715
Interest Rate
6.93%
Mortgage Type
VA
Estimated Equity
$751,946
Purchase Details
Closed on
Oct 25, 1993
Sold by
Nunez Maria Eloisa and Castaneda Marie Eloisa
Bought by
Nunez Maria Eloisa
Home Financials for this Owner
Home Financials are based on the most recent Mortgage that was taken out on this home.
Original Mortgage
$6,000
Interest Rate
6.95%
Purchase Details
Closed on
Aug 22, 1983
Create a Home Valuation Report for This Property
The Home Valuation Report is an in-depth analysis detailing your home's value as well as a comparison with similar homes in the area
Home Values in the Area
Average Home Value in this Area
Purchase History
| Date | Buyer | Sale Price | Title Company |
|---|---|---|---|
| Agas Arthur L | -- | First American Title Ins Co | |
| Agas Arthur L | $168,000 | First American Title Ins Co | |
| Nunez Maria Eloisa | -- | First American Title Co | |
| -- | $94,000 | -- |
Source: Public Records
Mortgage History
| Date | Status | Borrower | Loan Amount |
|---|---|---|---|
| Open | Agas Arthur L | $166,260 | |
| Previous Owner | Nunez Maria Eloisa | $6,000 |
Source: Public Records
Tax History Compared to Growth
Tax History
| Year | Tax Paid | Tax Assessment Tax Assessment Total Assessment is a certain percentage of the fair market value that is determined by local assessors to be the total taxable value of land and additions on the property. | Land | Improvement |
|---|---|---|---|---|
| 2025 | $3,120 | $263,348 | $68,908 | $194,440 |
| 2024 | $3,120 | $258,185 | $67,557 | $190,628 |
| 2023 | $3,049 | $253,124 | $66,233 | $186,891 |
| 2022 | $2,966 | $248,162 | $64,935 | $183,227 |
| 2021 | $2,944 | $243,297 | $63,662 | $179,635 |
| 2020 | $2,908 | $240,804 | $63,010 | $177,794 |
| 2019 | $2,855 | $236,083 | $61,775 | $174,308 |
| 2018 | $2,669 | $231,455 | $60,564 | $170,891 |
| 2017 | $2,604 | $226,918 | $59,377 | $167,541 |
| 2016 | $2,560 | $222,469 | $58,213 | $164,256 |
| 2015 | $2,521 | $219,128 | $57,339 | $161,789 |
| 2014 | $2,481 | $214,836 | $56,216 | $158,620 |
Source: Public Records
Map
Nearby Homes
- 763 Kingswood St
- 240 Ledgewood Ln
- 7449 Bullock Dr
- 124 Palawan Way
- 7263 Aquamarine Rd
- 177 Coralwood Dr
- 7281 Danawoods Ct
- 7549 Goode St
- 6872 Quebec Ct Unit 5
- 7040 Tenbury Ct
- 1153 Manzana Way
- 2620 Pennington Ln
- 849 Plaza Cuernavaca Way
- 111 69th St
- 7358 Gribble St
- 7853 Gribble St
- 7969 Royal Oak Place
- 2482 Manzana Way
- 1403 Manzana Way
- 7089 Wattle Dr
- 7115 Brookhaven Rd
- 7123 Brookhaven Rd
- 7111 Brookhaven Rd
- 524 Kingswood St
- 514 Kingswood St
- 534 Kingswood St
- 504 Kingswood St
- 1925 Park Valley Ln
- 1915 Park Valley Ln
- 544 Kingswood St
- 7107 Brookhaven Rd
- 486 Kingswood St
- 7125 Brookhaven Rd
- 476 Kingswood St
- 554 Kingswood St
- 7101 Brookhaven Rd
- 466 Kingswood St
- 7131 Brookhaven Rd
- 7118 Brookhaven Rd
- 7201 Farmdale St