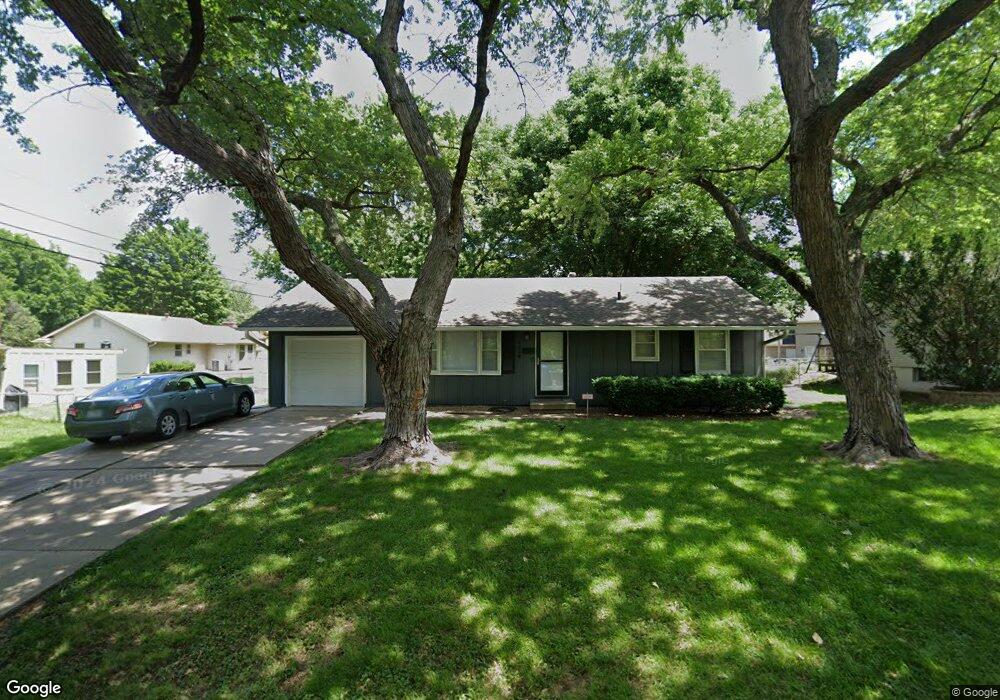
7119 Harvard Ave Raytown, MO 64133
Estimated Value: $178,000 - $216,000
3
Beds
2
Baths
912
Sq Ft
$217/Sq Ft
Est. Value
About This Home
This home is located at 7119 Harvard Ave, Raytown, MO 64133 and is currently estimated at $197,482, approximately $216 per square foot. 7119 Harvard Ave is a home located in Jackson County with nearby schools including Robinson Elementary School and Raytown Central Middle School.
Ownership History
Date
Name
Owned For
Owner Type
Purchase Details
Closed on
Mar 6, 2024
Sold by
Morgan Katie Louise
Bought by
Gatschet Jacob Boyd
Current Estimated Value
Purchase Details
Closed on
Jun 11, 2009
Sold by
Secretary Of Housing & Urban Development
Bought by
Gatschet Jacob
Home Financials for this Owner
Home Financials are based on the most recent Mortgage that was taken out on this home.
Original Mortgage
$44,190
Interest Rate
4.84%
Mortgage Type
FHA
Purchase Details
Closed on
Jan 25, 2008
Sold by
Gadino Brady Michael T and Gadino Brady Shelline L
Bought by
Secretary Of Housing & Urban Development
Purchase Details
Closed on
May 25, 2001
Sold by
Cullen Jason Paul and Cullen Angela R
Bought by
Brady Michael T and Gadino Brady Shelline L
Home Financials for this Owner
Home Financials are based on the most recent Mortgage that was taken out on this home.
Original Mortgage
$84,295
Interest Rate
7.01%
Mortgage Type
FHA
Create a Home Valuation Report for This Property
The Home Valuation Report is an in-depth analysis detailing your home's value as well as a comparison with similar homes in the area
Home Values in the Area
Average Home Value in this Area
Purchase History
| Date | Buyer | Sale Price | Title Company |
|---|---|---|---|
| Gatschet Jacob Boyd | -- | None Listed On Document | |
| Gatschet Jacob | -- | First American Title Ins Co | |
| Secretary Of Housing & Urban Development | $81,817 | None Available | |
| Brady Michael T | -- | First American Title Ins |
Source: Public Records
Mortgage History
| Date | Status | Borrower | Loan Amount |
|---|---|---|---|
| Previous Owner | Gatschet Jacob | $44,190 | |
| Previous Owner | Brady Michael T | $84,295 |
Source: Public Records
Tax History
| Year | Tax Paid | Tax Assessment Tax Assessment Total Assessment is a certain percentage of the fair market value that is determined by local assessors to be the total taxable value of land and additions on the property. | Land | Improvement |
|---|---|---|---|---|
| 2025 | $2,117 | $25,378 | $4,729 | $20,649 |
| 2024 | $2,117 | $23,463 | $3,547 | $19,916 |
| 2023 | $2,102 | $23,463 | $2,601 | $20,862 |
| 2022 | $1,805 | $19,190 | $3,908 | $15,282 |
| 2021 | $1,811 | $19,190 | $3,908 | $15,282 |
| 2020 | $1,736 | $18,220 | $3,908 | $14,312 |
| 2019 | $1,727 | $18,220 | $3,908 | $14,312 |
| 2018 | $1,451 | $15,857 | $3,401 | $12,456 |
| 2017 | $1,451 | $15,857 | $3,401 | $12,456 |
| 2016 | $1,407 | $15,461 | $2,936 | $12,525 |
| 2014 | $1,381 | $15,010 | $2,850 | $12,160 |
Source: Public Records
Map
Nearby Homes
- 7141 Sterling Ave
- 11101 E 72nd Terrace
- 7311 Hedges Ave
- 7317 Hedges Ave
- 6913 Englewood Ave
- 7402 Englewood Ln
- 10504 E 71st Terrace
- 7423 Harris Ave
- 7427 & 7429 Englewood Ln
- 7423 & 7425 Englewood Ln
- 7101 Willow Ave
- 6828 Vermont Ave
- 6817 Englewood Ave
- 7325 Hardy Ave
- 10208 E 71st Terrace
- 7421 Hardy Ave
- 6828 Lakeshore Dr
- 7416 Hardy Ave
- 7420 Hardy Ave
- 6817 Lakeshore Dr
- 7123 Harvard Ave
- 11101 E 71st Terrace
- 11100 E 72nd St
- 7201 Harvard Ave
- 11012 E 72nd St
- 11109 E 71st Terrace
- 11106 E 72nd St
- 11015 E 71st Terrace
- 11008 E 72nd St
- 11101 E 72nd St
- 11013 E 72nd St
- 11005 E 71st Terrace
- 7113 Harvard Ave
- 7140 Sterling Ave
- 7148 Sterling Ave
- 7209 Harvard Ave
- 7116 Sterling Ave
- 11004 E 72nd St
- 11112 E 71st Terrace
- 11001 E 71st Terrace
Your Personal Tour Guide
Ask me questions while you tour the home.