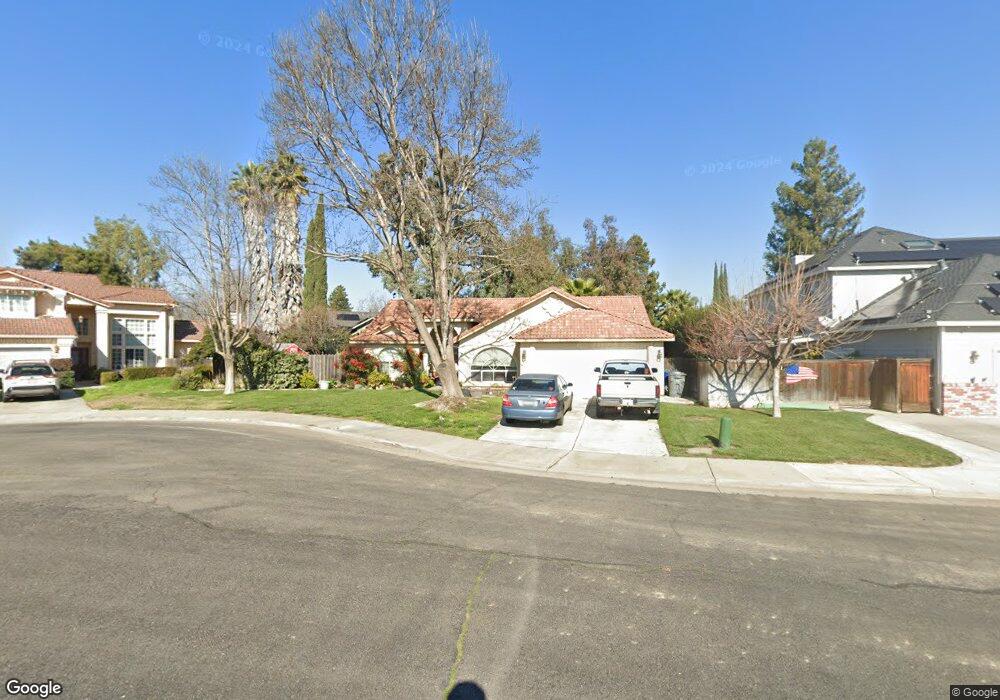
712 Alps Ct Los Banos, CA 93635
Estimated Value: $399,000 - $448,000
3
Beds
2
Baths
1,558
Sq Ft
$276/Sq Ft
Est. Value
About This Home
This home is located at 712 Alps Ct, Los Banos, CA 93635 and is currently estimated at $430,342, approximately $276 per square foot. 712 Alps Ct is a home located in Merced County with nearby schools including Los Banos Elementary School, Creekside Junior High School, and Los Banos High School.
Ownership History
Date
Name
Owned For
Owner Type
Purchase Details
Closed on
May 24, 2012
Sold by
Sloan Charlene
Bought by
Sloan Charlene and Charlene Sloan Living Trust
Current Estimated Value
Purchase Details
Closed on
May 19, 2006
Sold by
Sloan Stephen W
Bought by
Sloan Charlene
Purchase Details
Closed on
Apr 8, 1999
Sold by
Ranchwood Homes Corp
Bought by
Sloan Charlene A
Purchase Details
Closed on
Dec 22, 1998
Sold by
Sloan Steve
Bought by
Sloan Charlene A
Create a Home Valuation Report for This Property
The Home Valuation Report is an in-depth analysis detailing your home's value as well as a comparison with similar homes in the area
Home Values in the Area
Average Home Value in this Area
Purchase History
| Date | Buyer | Sale Price | Title Company |
|---|---|---|---|
| Sloan Charlene | -- | None Available | |
| Sloan Charlene | -- | None Available | |
| Sloan Charlene A | $146,500 | Fidelity National Title Co | |
| Sloan Charlene A | -- | Fidelity National Title Co |
Source: Public Records
Tax History Compared to Growth
Tax History
| Year | Tax Paid | Tax Assessment Tax Assessment Total Assessment is a certain percentage of the fair market value that is determined by local assessors to be the total taxable value of land and additions on the property. | Land | Improvement |
|---|---|---|---|---|
| 2025 | $2,821 | $229,648 | $54,858 | $174,790 |
| 2024 | $2,821 | $225,146 | $53,783 | $171,363 |
| 2023 | $2,655 | $220,732 | $52,729 | $168,003 |
| 2022 | $2,597 | $216,405 | $51,696 | $164,709 |
| 2021 | $2,554 | $212,163 | $50,683 | $161,480 |
| 2020 | $2,518 | $209,989 | $50,164 | $159,825 |
| 2019 | $2,472 | $205,873 | $49,181 | $156,692 |
| 2018 | $2,398 | $201,837 | $48,217 | $153,620 |
| 2017 | $2,368 | $197,880 | $47,272 | $150,608 |
| 2016 | $2,393 | $194,001 | $46,346 | $147,655 |
| 2015 | $2,347 | $191,088 | $45,650 | $145,438 |
| 2014 | $2,288 | $187,346 | $44,756 | $142,590 |
Source: Public Records
Map
Nearby Homes