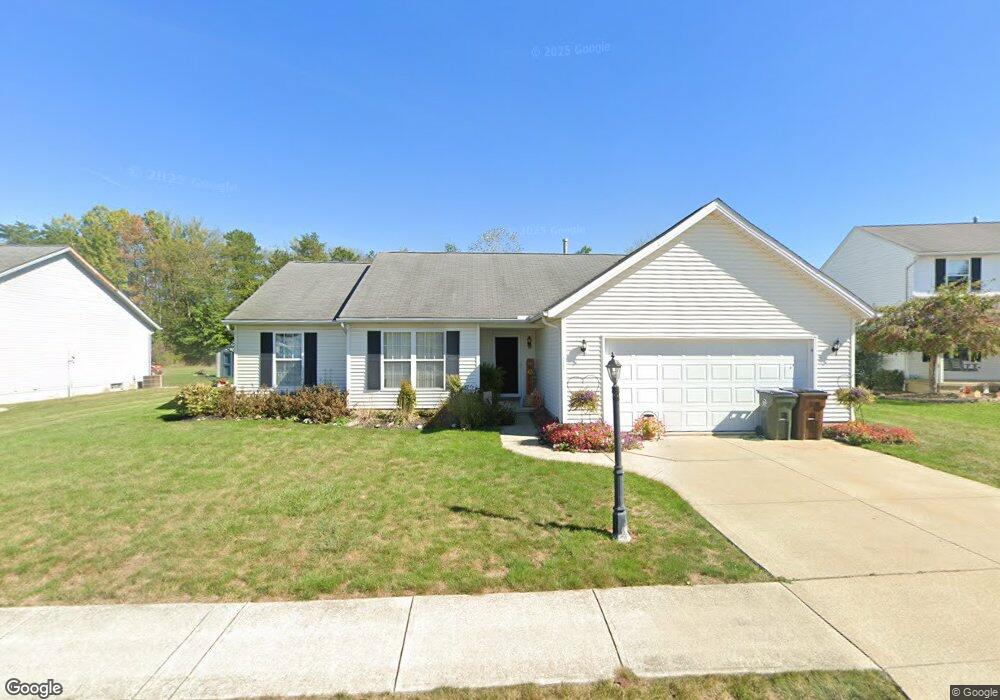
712 Black Bear Run Lagrange, OH 44050
Estimated Value: $238,000 - $314,000
3
Beds
2
Baths
1,610
Sq Ft
$162/Sq Ft
Est. Value
About This Home
This home is located at 712 Black Bear Run, Lagrange, OH 44050 and is currently estimated at $260,315, approximately $161 per square foot. 712 Black Bear Run is a home located in Lorain County with nearby schools including Keystone Elementary School, Keystone Middle School, and Keystone High School.
Ownership History
Date
Name
Owned For
Owner Type
Purchase Details
Closed on
Dec 9, 2010
Sold by
Bachman Russ
Bought by
Bachman Jennifer R
Current Estimated Value
Purchase Details
Closed on
Sep 17, 2005
Sold by
Lesiw Jennifer R and Bachman Jennifer R
Bought by
Bachman Russ and Bachman Jennifer R
Home Financials for this Owner
Home Financials are based on the most recent Mortgage that was taken out on this home.
Original Mortgage
$110,400
Outstanding Balance
$58,544
Interest Rate
5.71%
Mortgage Type
New Conventional
Estimated Equity
$201,771
Purchase Details
Closed on
Sep 20, 2002
Sold by
David Development Inc
Bought by
Lesiw Jennifer R
Home Financials for this Owner
Home Financials are based on the most recent Mortgage that was taken out on this home.
Original Mortgage
$120,650
Interest Rate
6.4%
Create a Home Valuation Report for This Property
The Home Valuation Report is an in-depth analysis detailing your home's value as well as a comparison with similar homes in the area
Home Values in the Area
Average Home Value in this Area
Purchase History
| Date | Buyer | Sale Price | Title Company |
|---|---|---|---|
| Bachman Jennifer R | -- | Attorney | |
| Bachman Russ | -- | Tier One Title | |
| Lesiw Jennifer R | $127,000 | Chicago Title Insurance Co |
Source: Public Records
Mortgage History
| Date | Status | Borrower | Loan Amount |
|---|---|---|---|
| Open | Bachman Russ | $110,400 | |
| Closed | Lesiw Jennifer R | $120,650 |
Source: Public Records
Tax History
| Year | Tax Paid | Tax Assessment Tax Assessment Total Assessment is a certain percentage of the fair market value that is determined by local assessors to be the total taxable value of land and additions on the property. | Land | Improvement |
|---|---|---|---|---|
| 2024 | $2,953 | $63,074 | $12,425 | $50,649 |
| 2023 | $2,553 | $45,584 | $12,012 | $33,572 |
| 2022 | $2,536 | $45,584 | $12,012 | $33,572 |
| 2021 | $2,536 | $45,584 | $12,012 | $33,572 |
| 2020 | $2,491 | $39,850 | $10,500 | $29,350 |
| 2019 | $2,477 | $39,850 | $10,500 | $29,350 |
| 2018 | $2,118 | $39,850 | $10,500 | $29,350 |
| 2017 | $2,116 | $37,270 | $7,810 | $29,460 |
| 2016 | $2,100 | $37,270 | $7,810 | $29,460 |
| 2015 | $2,097 | $37,270 | $7,810 | $29,460 |
| 2014 | $1,638 | $33,430 | $7,000 | $26,430 |
| 2013 | $1,587 | $33,430 | $7,000 | $26,430 |
Source: Public Records
Map
Nearby Homes
- 704 Black Bear Run
- 46 Perch Ct
- 42113 Meadow Ln
- 479 Stallion Ct
- 476 Stallion Ct
- 510 Arabian Ct
- 468 Stallion Ct
- 0 West Rd Unit 5125531
- 43311 Peck Wadsworth Rd
- 0 Whitehead Rd
- 20630 State Route 301
- 43902 State Route 303
- 110 Railroad St
- 305 W Main St
- 40260 Whitney Rd
- 516 Appomattox Ct
- 0 Ohio 301
- 548 William St
- 608 Rundle St
- 340 Granger Dr
- 711 Black Bear Run
- 713 Black Bear Run
- 710 Black Bear Run
- 731 Grey Wolfe Dr
- 714 Black Bear Run
- 732 Bobcat Dr
- 715 Grey Wolfe Dr
- 709 Black Bear Run
- 730 Grey Wolfe Dr
- 716 Grey Wolfe Dr
- 708 Black Bear Run
- 717 Grey Wolfe Dr
- 729 Grey Wolfe Dr
- 734 Bobcat Dr
- 707 Black Bear Run
- 718 Grey Wolfe Dr
- 728 Grey Wolfe Dr
- 746 Bobcat Dr
- 735 Bobcat Dr
- 94 Pike Ct
Your Personal Tour Guide
Ask me questions while you tour the home.