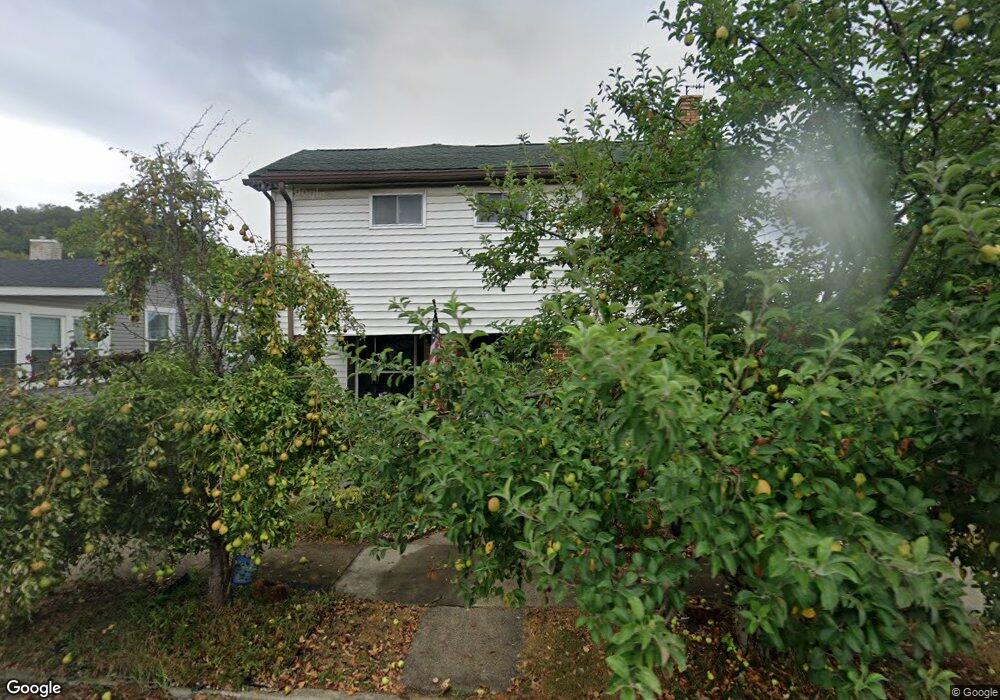
712 Daniels St Toronto, OH 43964
Estimated Value: $124,980 - $171,000
3
Beds
2
Baths
1,584
Sq Ft
$92/Sq Ft
Est. Value
About This Home
This home is located at 712 Daniels St, Toronto, OH 43964 and is currently estimated at $144,995, approximately $91 per square foot. 712 Daniels St is a home located in Jefferson County with nearby schools including Toronto Jr./Sr. High School and St. Francis Central School.
Ownership History
Date
Name
Owned For
Owner Type
Purchase Details
Closed on
Dec 6, 2017
Sold by
Williamson Damian R
Bought by
Williamson Damian R and Williamson Leah M
Current Estimated Value
Home Financials for this Owner
Home Financials are based on the most recent Mortgage that was taken out on this home.
Original Mortgage
$36,000
Outstanding Balance
$24,325
Interest Rate
3.94%
Mortgage Type
New Conventional
Estimated Equity
$120,670
Purchase Details
Closed on
Apr 20, 2009
Sold by
Lamantia Thomas A and Croghan Brabara A
Bought by
Williamson Damian R
Home Financials for this Owner
Home Financials are based on the most recent Mortgage that was taken out on this home.
Original Mortgage
$39,275
Interest Rate
5.05%
Create a Home Valuation Report for This Property
The Home Valuation Report is an in-depth analysis detailing your home's value as well as a comparison with similar homes in the area
Home Values in the Area
Average Home Value in this Area
Purchase History
We collect this data history from publicly available records. To have your information removed, we recommend requesting removal directly through your county’s website.
| Date | Buyer | Sale Price | Title Company |
|---|---|---|---|
| Williamson Damian R | -- | None Available | |
| Williamson Damian R | -- | -- |
Source: Public Records
Mortgage History
We collect this data history from publicly available records. To have your information removed, we recommend requesting removal directly through your county’s website.
| Date | Status | Borrower | Loan Amount |
|---|---|---|---|
| Open | Williamson Damian R | $36,000 | |
| Closed | Williamson Damian R | $39,275 |
Source: Public Records
Tax History
| Year | Tax Paid | Tax Assessment Tax Assessment Total Assessment is a certain percentage of the fair market value that is determined by local assessors to be the total taxable value of land and additions on the property. | Land | Improvement |
|---|---|---|---|---|
| 2025 | $2,208 | $32,347 | $4,767 | $27,580 |
| 2024 | $1,291 | $32,347 | $4,767 | $27,580 |
| 2023 | $1,134 | $24,497 | $4,011 | $20,486 |
| 2022 | $920 | $24,497 | $4,011 | $20,486 |
| 2021 | $920 | $24,497 | $4,011 | $20,486 |
| 2020 | $791 | $20,580 | $3,255 | $17,325 |
| 2019 | $794 | $0 | $0 | $0 |
| 2018 | $794 | $0 | $0 | $0 |
| 2017 | $790 | $0 | $0 | $0 |
| 2016 | $804 | $0 | $0 | $0 |
| 2015 | $794 | $0 | $0 | $0 |
| 2014 | $766 | $0 | $0 | $0 |
| 2012 | $376 | $18,025 | $3,570 | $14,455 |
Source: Public Records
Map
Nearby Homes
- 707 Daniels St
- 709 Daniels St
- 711 Daniels St
- 701 Daniels St
- 706 Loretta Ave
- 708 Loretta Ave
- 713 Daniels St
- 704 Loretta Ave
- 308 Grant St
- 706 Daniels St
- 704 Daniels St
- 702 Daniels St
- 710 Loretta Ave
- 715 Daniels St
- 712 Loretta Ave
- 702 Loretta Ave
- 714 Daniels St
- 717 Daniels St
- 714 Loretta Ave
- 501 Daniels St
Your Personal Tour Guide
Ask me questions while you tour the home.