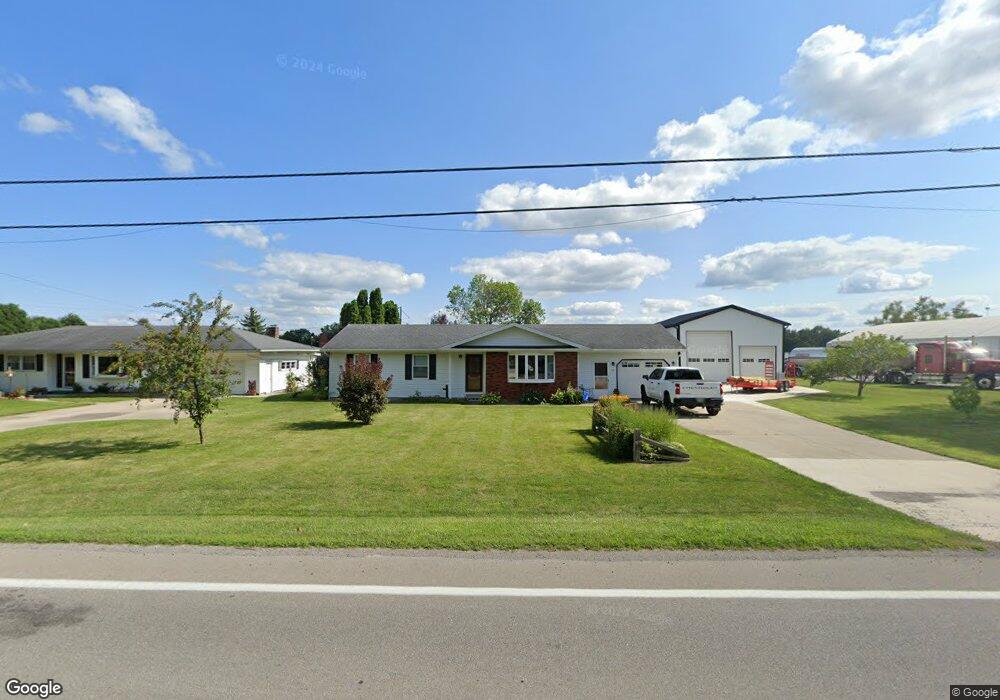
712 E Jackson St West Unity, OH 43570
Estimated Value: $193,000 - $213,000
3
Beds
2
Baths
1,484
Sq Ft
$139/Sq Ft
Est. Value
About This Home
This home is located at 712 E Jackson St, West Unity, OH 43570 and is currently estimated at $206,028, approximately $138 per square foot. 712 E Jackson St is a home located in Williams County with nearby schools including Hilltop Elementary School and Hilltop High School.
Ownership History
Date
Name
Owned For
Owner Type
Purchase Details
Closed on
Mar 21, 2025
Sold by
Pfleger James C and Clark Nancy
Bought by
Merica Brands Llc
Current Estimated Value
Purchase Details
Closed on
Sep 9, 2021
Sold by
Bunting Rita S
Bought by
Pfleger James C
Purchase Details
Closed on
Aug 8, 2019
Sold by
Pfleger James C
Bought by
Pfleger James C and Pfleger J
Purchase Details
Closed on
Dec 9, 2013
Sold by
Pfleger James C and Bunting Rita S
Bought by
Pfleger James C and Bunting Rita S
Purchase Details
Closed on
Dec 16, 1998
Sold by
Mclaughlin Clark E
Bought by
Mclaughlin Clark E Trustee
Purchase Details
Closed on
Apr 8, 1993
Sold by
Mclaughlin Clark And
Bought by
Mclaughlin Clark And
Create a Home Valuation Report for This Property
The Home Valuation Report is an in-depth analysis detailing your home's value as well as a comparison with similar homes in the area
Purchase History
| Date | Buyer | Sale Price | Title Company |
|---|---|---|---|
| Merica Brands Llc | $200,000 | None Listed On Document | |
| Merica Brands Llc | $200,000 | None Listed On Document | |
| Pfleger James C | $9,000 | None Available | |
| Pfleger James C | -- | -- | |
| Pfleger James C | -- | None Available | |
| Mclaughlin Clark E Trustee | -- | -- | |
| Mclaughlin Clark And | -- | -- |
Source: Public Records
Tax History
| Year | Tax Paid | Tax Assessment Tax Assessment Total Assessment is a certain percentage of the fair market value that is determined by local assessors to be the total taxable value of land and additions on the property. | Land | Improvement |
|---|---|---|---|---|
| 2025 | $2,449 | $60,730 | $8,650 | $52,080 |
| 2024 | $2,449 | $60,730 | $8,650 | $52,080 |
| 2023 | $2,441 | $44,840 | $8,510 | $36,330 |
| 2022 | $2,145 | $38,540 | $8,510 | $30,030 |
| 2021 | $1,839 | $38,540 | $8,510 | $30,030 |
| 2020 | $1,656 | $33,500 | $7,390 | $26,110 |
| 2019 | $1,630 | $31,820 | $5,710 | $26,110 |
| 2018 | $1,566 | $31,820 | $5,710 | $26,110 |
| 2017 | $1,293 | $26,330 | $5,430 | $20,900 |
| 2016 | $1,233 | $26,330 | $5,430 | $20,900 |
| 2015 | $1,406 | $26,330 | $5,430 | $20,900 |
| 2014 | $1,406 | $27,690 | $5,710 | $21,980 |
| 2013 | $1,393 | $27,690 | $5,710 | $21,980 |
Source: Public Records
Map
Nearby Homes
- 902 E Church St
- 000 W Jackson
- 106 W Catherine St
- 309 S Defiance St
- 22227 Us Highway 20a
- 20095 County Road H50
- 16806 US Highway 20a
- 3514 Gaslight Dr
- 301 Horton St
- 14640 U S 20a
- 23161 County Road Jk
- 200 Tyler Ln
- 552 Quail Run
- 0 St Rt 15 Unit 10001011
- 16299 County Road F75
- 0 US Highway 20a
- 301 N Pointe Dr
- 328 W Lutz Rd Unit 328
- 7100 County Road 15-50
- 408 Ditto St
- 714 E Jackson St
- 716 E Jackson St
- 715 E Jackson St
- 711 E Jackson St
- 718 E Jackson St
- 719 E Jackson St
- 714 E North St
- 716 E North St
- 718 E North St
- 712 E North St
- 720 E Jackson St
- 709 E Jackson St
- 720 E North St
- 721 E Jackson St
- 710 E North St
- 707 E Jackson St
- 722 E Jackson St
- 722 E North St
- 708 E North St
- 713 E North St
Your Personal Tour Guide
Ask me questions while you tour the home.