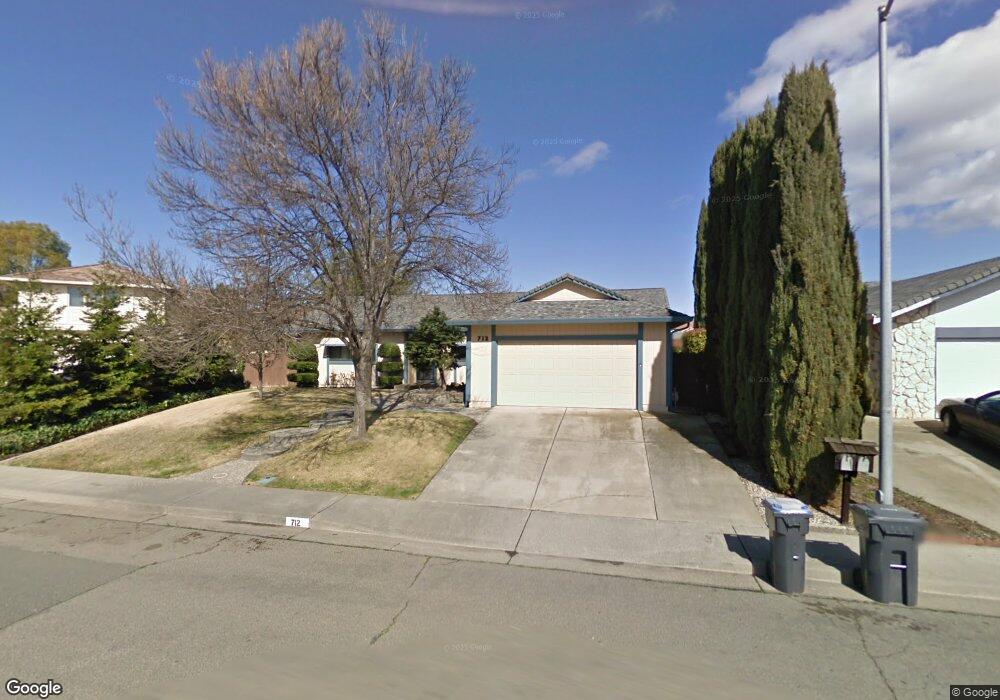
712 Lantana Place Fairfield, CA 94533
Estimated Value: $492,000 - $553,352
4
Beds
2
Baths
1,877
Sq Ft
$286/Sq Ft
Est. Value
About This Home
This home is located at 712 Lantana Place, Fairfield, CA 94533 and is currently estimated at $536,338, approximately $285 per square foot. 712 Lantana Place is a home located in Solano County with nearby schools including Laurel Creek Elementary School, Grange Middle School, and Fairfield High School.
Ownership History
Date
Name
Owned For
Owner Type
Purchase Details
Closed on
Sep 23, 2022
Sold by
Garcia Cynthia K
Bought by
Garcia Steele Family Trust
Current Estimated Value
Purchase Details
Closed on
Aug 19, 2021
Sold by
Steele Richard A
Bought by
Garcia Cynthia K
Home Financials for this Owner
Home Financials are based on the most recent Mortgage that was taken out on this home.
Original Mortgage
$217,000
Interest Rate
2.2%
Mortgage Type
New Conventional
Purchase Details
Closed on
Jan 23, 2020
Sold by
Moulds Sylvia Koga
Bought by
Garcia Cynthia K
Purchase Details
Closed on
Jan 16, 2020
Sold by
Garcia Cynthia K and Simon G And Marie M Garcia Tru
Bought by
Moulds Sylvia Koga
Purchase Details
Closed on
Jan 20, 1995
Sold by
Garcia Simon G and Garcia Marie M
Bought by
Garcia Simon G and Garcia Marie M
Create a Home Valuation Report for This Property
The Home Valuation Report is an in-depth analysis detailing your home's value as well as a comparison with similar homes in the area
Home Values in the Area
Average Home Value in this Area
Purchase History
| Date | Buyer | Sale Price | Title Company |
|---|---|---|---|
| Garcia Steele Family Trust | -- | -- | |
| Garcia Cynthia K | -- | Solidifi Title & Closing | |
| Garcia Cynthia K | $215,000 | None Available | |
| Moulds Sylvia Koga | -- | None Available | |
| Garcia Simon G | -- | -- |
Source: Public Records
Mortgage History
| Date | Status | Borrower | Loan Amount |
|---|---|---|---|
| Previous Owner | Garcia Cynthia K | $217,000 |
Source: Public Records
Tax History Compared to Growth
Tax History
| Year | Tax Paid | Tax Assessment Tax Assessment Total Assessment is a certain percentage of the fair market value that is determined by local assessors to be the total taxable value of land and additions on the property. | Land | Improvement |
|---|---|---|---|---|
| 2025 | $3,564 | $325,239 | $93,799 | $231,440 |
| 2024 | $3,564 | $318,862 | $91,960 | $226,902 |
| 2023 | $3,453 | $312,610 | $90,158 | $222,452 |
| 2022 | $3,410 | $306,482 | $88,391 | $218,091 |
| 2021 | $3,375 | $300,473 | $86,658 | $213,815 |
| 2020 | $1,603 | $139,786 | $36,540 | $103,246 |
| 2019 | $1,486 | $137,046 | $35,824 | $101,222 |
| 2018 | $1,531 | $134,360 | $35,122 | $99,238 |
| 2017 | $1,460 | $131,727 | $34,434 | $97,293 |
| 2016 | $1,440 | $129,145 | $33,759 | $95,386 |
| 2015 | $1,344 | $127,206 | $33,252 | $93,954 |
| 2014 | $1,330 | $124,715 | $32,601 | $92,114 |
Source: Public Records
Map
Nearby Homes
- 727 Shamrock Ct
- 675 Hillside Dr
- 3101 Arroyo Ct
- 743 Isabella Way
- 722 Rosemary Ct
- 3015 Redwood Dr
- 558 Maywood Way
- 2924 Redwood Dr
- 3265 Arroyo Dr
- 2532 Cyan Dr
- 2462 Shore Vista Unit 4752
- 3087 Pecan Cir
- 3276 Arroyo Dr
- 2859 Elmhurst Cir
- 523 El Camino Dr
- 738 Marsh Place
- 705 Otter Ct
- 703 Mustang Ct
- 1031 Suffolk Way
- 2571 Sunrise Dr
- 718 Lantana Place
- 706 Lantana Place
- 3000 Chestnut Ct
- 713 Lantana Place
- 3003 Juniper Ct
- 719 Lantana Place
- 700 Lantana Place
- 707 Lantana Place
- 701 Lantana Place
- 2998 Juniper St
- 2992 Juniper St
- 3001 Chestnut Ct
- 3006 Chestnut Ct
- 3009 Juniper Ct
- 2986 Juniper St
- 716 Shamrock Ct
- 710 Shamrock Ct
- 3004 Juniper Ct
- 722 Shamrock Ct
- 2980 Juniper St