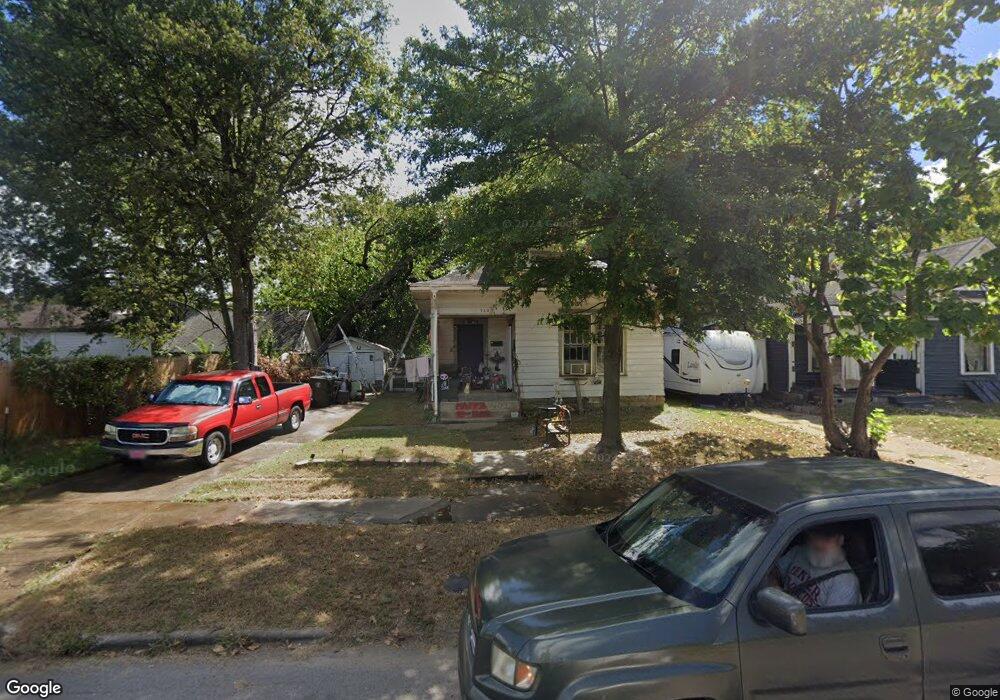
712 N E St Muskogee, OK 74403
Central Muskogee NeighborhoodEstimated Value: $49,000 - $71,000
2
Beds
1
Bath
1,092
Sq Ft
$52/Sq Ft
Est. Value
About This Home
This home is located at 712 N E St, Muskogee, OK 74403 and is currently estimated at $56,745, approximately $51 per square foot. 712 N E St is a home located in Muskogee County with nearby schools including Irving Elementary School, 8th & 9th Grade Academy @ Alice Robertson, and Muskogee High School.
Ownership History
Date
Name
Owned For
Owner Type
Purchase Details
Closed on
May 16, 2013
Sold by
Carlson Judi G and Carlson Matthew D
Bought by
Carlson Matthew D and Carlson Nichole R
Current Estimated Value
Purchase Details
Closed on
Sep 15, 2006
Sold by
Swertz & Brough Inc
Bought by
Gleese Sharon
Home Financials for this Owner
Home Financials are based on the most recent Mortgage that was taken out on this home.
Original Mortgage
$28,738
Interest Rate
6.51%
Mortgage Type
Purchase Money Mortgage
Purchase Details
Closed on
Feb 4, 2005
Sold by
Donaldson Michelle
Bought by
Lawson Robert
Home Financials for this Owner
Home Financials are based on the most recent Mortgage that was taken out on this home.
Original Mortgage
$50,400
Interest Rate
7.74%
Mortgage Type
Adjustable Rate Mortgage/ARM
Purchase Details
Closed on
Dec 31, 2003
Purchase Details
Closed on
May 1, 1989
Create a Home Valuation Report for This Property
The Home Valuation Report is an in-depth analysis detailing your home's value as well as a comparison with similar homes in the area
Home Values in the Area
Average Home Value in this Area
Purchase History
| Date | Buyer | Sale Price | Title Company |
|---|---|---|---|
| Carlson Matthew D | -- | None Available | |
| Gleese Sharon | $32,000 | None Available | |
| Lawson Robert | $56,000 | None Available | |
| -- | $50,000 | -- | |
| -- | $500 | -- |
Source: Public Records
Mortgage History
| Date | Status | Borrower | Loan Amount |
|---|---|---|---|
| Closed | Gleese Sharon | $28,738 | |
| Previous Owner | Lawson Robert | $50,400 |
Source: Public Records
Tax History Compared to Growth
Tax History
| Year | Tax Paid | Tax Assessment Tax Assessment Total Assessment is a certain percentage of the fair market value that is determined by local assessors to be the total taxable value of land and additions on the property. | Land | Improvement |
|---|---|---|---|---|
| 2024 | $277 | $2,542 | $275 | $2,267 |
| 2023 | $277 | $2,421 | $264 | $2,157 |
| 2022 | $241 | $2,421 | $264 | $2,157 |
| 2021 | $242 | $2,421 | $264 | $2,157 |
| 2020 | $243 | $2,421 | $264 | $2,157 |
| 2019 | $241 | $2,425 | $264 | $2,161 |
| 2018 | $236 | $2,425 | $264 | $2,161 |
| 2017 | $229 | $2,425 | $264 | $2,161 |
| 2016 | $231 | $2,425 | $264 | $2,161 |
| 2015 | $229 | $2,425 | $264 | $2,161 |
| 2014 | $233 | $2,425 | $264 | $2,161 |
Source: Public Records
Map
Nearby Homes