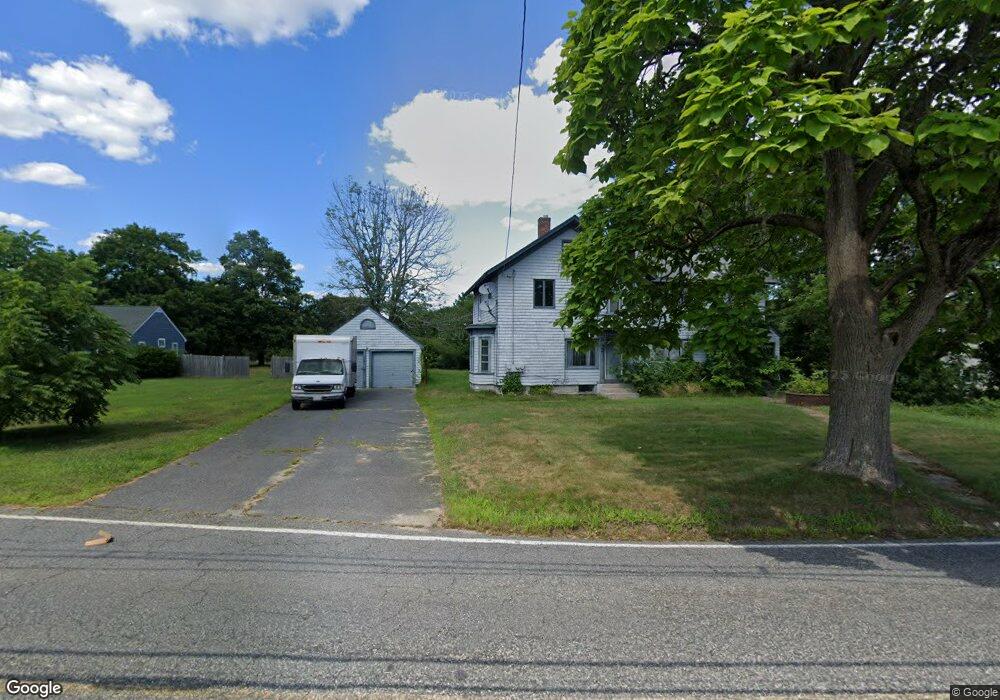
712 Read St Attleboro, MA 02703
Estimated Value: $474,339 - $624,000
4
Beds
2
Baths
2,302
Sq Ft
$242/Sq Ft
Est. Value
About This Home
This home is located at 712 Read St, Attleboro, MA 02703 and is currently estimated at $556,585, approximately $241 per square foot. 712 Read St is a home located in Bristol County with nearby schools including Hill-Roberts Elementary School, Robert J. Coelho Middle School, and Attleboro High School.
Ownership History
Date
Name
Owned For
Owner Type
Purchase Details
Closed on
Jul 7, 2022
Sold by
Eastlande Park Corp
Bought by
Lse Properties Llc
Current Estimated Value
Purchase Details
Closed on
Oct 21, 1996
Sold by
Ritacco John B
Bought by
Eastlande Park Corp
Purchase Details
Closed on
May 23, 1996
Sold by
Casey Edward F and Desnoyers Paul
Bought by
Eastlande Park Corp
Create a Home Valuation Report for This Property
The Home Valuation Report is an in-depth analysis detailing your home's value as well as a comparison with similar homes in the area
Home Values in the Area
Average Home Value in this Area
Purchase History
| Date | Buyer | Sale Price | Title Company |
|---|---|---|---|
| Lse Properties Llc | -- | None Available | |
| Lse Properties Llc | -- | None Available | |
| Eastlande Park Corp | $1,000 | -- | |
| Eastlande Park Corp | $42,000 | -- |
Source: Public Records
Tax History Compared to Growth
Tax History
| Year | Tax Paid | Tax Assessment Tax Assessment Total Assessment is a certain percentage of the fair market value that is determined by local assessors to be the total taxable value of land and additions on the property. | Land | Improvement |
|---|---|---|---|---|
| 2025 | $4,804 | $382,800 | $163,200 | $219,600 |
| 2024 | $4,569 | $358,900 | $163,200 | $195,700 |
| 2023 | $4,503 | $328,900 | $150,000 | $178,900 |
| 2022 | $4,381 | $303,200 | $143,800 | $159,400 |
| 2021 | $4,097 | $276,800 | $139,000 | $137,800 |
| 2020 | $3,821 | $262,400 | $135,400 | $127,000 |
| 2019 | $3,496 | $246,900 | $133,200 | $113,700 |
| 2018 | $3,401 | $229,500 | $129,800 | $99,700 |
| 2017 | $3,297 | $226,600 | $129,800 | $96,800 |
| 2016 | $3,247 | $219,100 | $128,500 | $90,600 |
| 2015 | $3,052 | $207,500 | $128,500 | $79,000 |
| 2014 | $2,811 | $189,300 | $122,400 | $66,900 |
Source: Public Records
Map
Nearby Homes