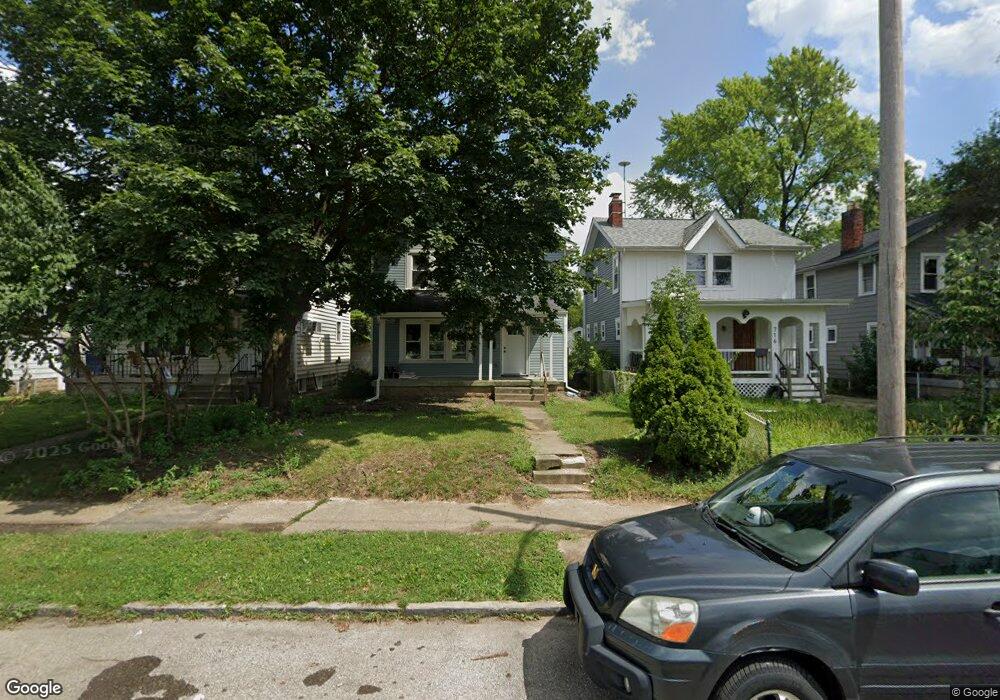
712 S Ogden Ave Columbus, OH 43204
South Central Hilltop NeighborhoodEstimated Value: $89,666 - $202,000
3
Beds
4
Baths
1,328
Sq Ft
$118/Sq Ft
Est. Value
About This Home
This home is located at 712 S Ogden Ave, Columbus, OH 43204 and is currently estimated at $156,667, approximately $117 per square foot. 712 S Ogden Ave is a home located in Franklin County with nearby schools including Burroughs Elementary School, Hilltonia Middle School, and Briggs High School.
Ownership History
Date
Name
Owned For
Owner Type
Purchase Details
Closed on
Jul 2, 2024
Sold by
Adelphoi Development Group Llc
Bought by
Bartholomew Richard S
Current Estimated Value
Purchase Details
Closed on
Jun 17, 2024
Sold by
Adelphoi Development Group Llc
Bought by
Bartholomew Richard S
Purchase Details
Closed on
Jul 21, 2008
Sold by
Deutsche Bank National Trust Co
Bought by
Adelphoi Development Group Llc
Purchase Details
Closed on
Jan 22, 2008
Sold by
Tackett Deanna K and Case #06Cve04 5092
Bought by
Deutsche Bank National Trust Co and Aames Mortgage Trust 2002-1 Mortgage Pas
Purchase Details
Closed on
Sep 19, 1997
Sold by
Sobieski Bernard M
Bought by
Tackett Deanna K
Home Financials for this Owner
Home Financials are based on the most recent Mortgage that was taken out on this home.
Original Mortgage
$25,000
Interest Rate
7.63%
Mortgage Type
Seller Take Back
Purchase Details
Closed on
Feb 27, 1990
Create a Home Valuation Report for This Property
The Home Valuation Report is an in-depth analysis detailing your home's value as well as a comparison with similar homes in the area
Home Values in the Area
Average Home Value in this Area
Purchase History
| Date | Buyer | Sale Price | Title Company |
|---|---|---|---|
| Bartholomew Richard S | -- | None Listed On Document | |
| Bartholomew Richard S | -- | None Listed On Document | |
| Adelphoi Development Group Llc | $5,500 | Titlequest | |
| Deutsche Bank National Trust Co | $34,000 | Titlequest | |
| Tackett Deanna K | $50,000 | -- | |
| -- | $2,600 | -- |
Source: Public Records
Mortgage History
| Date | Status | Borrower | Loan Amount |
|---|---|---|---|
| Previous Owner | Tackett Deanna K | $25,000 |
Source: Public Records
Tax History Compared to Growth
Tax History
| Year | Tax Paid | Tax Assessment Tax Assessment Total Assessment is a certain percentage of the fair market value that is determined by local assessors to be the total taxable value of land and additions on the property. | Land | Improvement |
|---|---|---|---|---|
| 2024 | $374 | $8,330 | $4,620 | $3,710 |
| 2023 | $377 | $8,330 | $4,620 | $3,710 |
| 2022 | $233 | $4,380 | $2,030 | $2,350 |
| 2021 | $233 | $4,380 | $2,030 | $2,350 |
| 2020 | $234 | $4,380 | $2,030 | $2,350 |
| 2019 | $226 | $3,640 | $1,680 | $1,960 |
| 2018 | $290 | $3,680 | $1,680 | $2,000 |
| 2017 | $307 | $3,680 | $1,680 | $2,000 |
| 2016 | $385 | $5,670 | $5,390 | $280 |
| 2015 | $351 | $5,670 | $5,390 | $280 |
| 2014 | $352 | $5,670 | $5,390 | $280 |
| 2013 | $204 | $6,650 | $6,335 | $315 |
Source: Public Records
Map
Nearby Homes
- 730 S Burgess Ave
- 678 S Warren Ave
- 727 S Richardson Ave
- 677 S Warren Ave
- 734 S Richardson Ave
- 620 S Warren Ave
- 614 S Warren Ave
- 599 S Burgess Ave Unit 601
- 805 S Warren Ave
- 790 Racine Ave
- 595 S Warren Ave
- 651 S Terrace Ave
- 596 - 598 Racine Ave
- 554 S Ogden Ave
- 2687 Vanderberg Ave
- 2585 Eakin Rd
- 690 S Hague Ave
- 2579 Eakin Rd
- 2715 Sullivant Ave
- 586 S Hague Ave
- 708 S Ogden Ave
- 716 S Ogden Ave
- 708 S Ogden Ave Unit OZEM
- 704 S Ogden Ave
- 720 S Ogden Ave
- 724 S Ogden Ave
- 700 S Ogden Ave Unit OZEM
- 700 S Ogden Ave
- 696 S Ogden Ave
- 692 S Ogden Ave
- 730 S Ogden Ave
- 730 S Ogden Ave Unit 732
- 723 S Burgess Ave
- 719 S Burgess Ave
- 715 S Burgess Ave
- 686 S Ogden Ave
- 709 S Ogden Ave Unit OZEM
- 729 S Burgess Ave
- 738 S Ogden Ave
- 711 S Burgess Ave