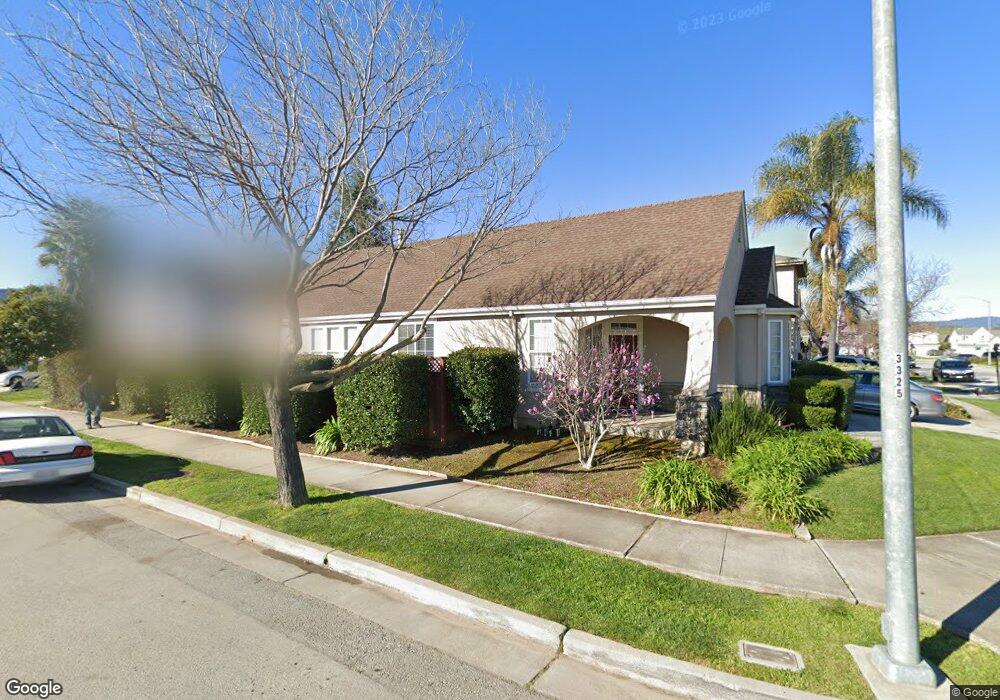
712 Saint Clar Ave Gilroy, CA 95020
Las Animas NeighborhoodEstimated Value: $950,000 - $1,049,000
4
Beds
2
Baths
1,835
Sq Ft
$538/Sq Ft
Est. Value
About This Home
This home is located at 712 Saint Clar Ave, Gilroy, CA 95020 and is currently estimated at $986,592, approximately $537 per square foot. 712 Saint Clar Ave is a home located in Santa Clara County with nearby schools including South Valley Middle School, Solorsano Middle School, and Christopher High School.
Ownership History
Date
Name
Owned For
Owner Type
Purchase Details
Closed on
Apr 24, 2018
Sold by
Cadiente Frederic J and Cadiente Roberta
Bought by
Cadiente Frederic J and Cadiente Roberta
Current Estimated Value
Purchase Details
Closed on
Mar 28, 2006
Sold by
Mendoza Janette and Mendoza Alex
Bought by
Cadiente Frederic J and Cadiente Roberta A
Home Financials for this Owner
Home Financials are based on the most recent Mortgage that was taken out on this home.
Original Mortgage
$568,000
Outstanding Balance
$260,300
Interest Rate
3%
Mortgage Type
Purchase Money Mortgage
Estimated Equity
$726,292
Purchase Details
Closed on
Mar 8, 2002
Sold by
Mendoza Alex and Mendoza Janette
Bought by
Mendoza Alex and Mendoza Janette
Purchase Details
Closed on
Dec 9, 1999
Sold by
Kern Avenue Group Llc
Bought by
Mendoza Alex and Mendoza Janette
Home Financials for this Owner
Home Financials are based on the most recent Mortgage that was taken out on this home.
Original Mortgage
$240,000
Interest Rate
7.82%
Create a Home Valuation Report for This Property
The Home Valuation Report is an in-depth analysis detailing your home's value as well as a comparison with similar homes in the area
Home Values in the Area
Average Home Value in this Area
Purchase History
We collect this data history from publicly available records. To have your information removed, we recommend requesting removal directly through your county’s website.
| Date | Buyer | Sale Price | Title Company |
|---|---|---|---|
| Cadiente Frederic J | -- | None Available | |
| Cadiente Frederic J | $710,000 | Alliance Title Company | |
| Mendoza Alex | -- | Fidelity National Title Co | |
| Mendoza Alex | $327,500 | Chicago Title Co |
Source: Public Records
Mortgage History
We collect this data history from publicly available records. To have your information removed, we recommend requesting removal directly through your county’s website.
| Date | Status | Borrower | Loan Amount |
|---|---|---|---|
| Open | Cadiente Frederic J | $568,000 | |
| Previous Owner | Mendoza Alex | $240,000 | |
| Closed | Mendoza Alex | $22,000 |
Source: Public Records
Tax History
| Year | Tax Paid | Tax Assessment Tax Assessment Total Assessment is a certain percentage of the fair market value that is determined by local assessors to be the total taxable value of land and additions on the property. | Land | Improvement |
|---|---|---|---|---|
| 2025 | $1,859 | $150,567 | $41,560 | $109,007 |
| 2024 | $1,859 | $147,616 | $40,746 | $106,870 |
| 2023 | $1,846 | $144,723 | $39,948 | $104,775 |
| 2022 | $1,812 | $141,886 | $39,165 | $102,721 |
| 2021 | $1,800 | $139,105 | $38,398 | $100,707 |
| 2020 | $1,779 | $137,680 | $38,005 | $99,675 |
| 2019 | $1,762 | $134,981 | $37,260 | $97,721 |
| 2018 | $1,648 | $132,335 | $36,530 | $95,805 |
| 2017 | $1,678 | $129,741 | $35,814 | $93,927 |
| 2016 | $1,634 | $127,198 | $35,112 | $92,086 |
| 2015 | $1,543 | $125,288 | $34,585 | $90,703 |
| 2014 | $1,531 | $122,835 | $33,908 | $88,927 |
Source: Public Records
Map
Nearby Homes
- 9110 Avezan Way
- 735 Painter Ct
- 887 Martiri Dr
- 590 El Invierno Dr
- 500 Ronan Ave
- 8881 Zinnia St
- 777 Lawrence Dr
- 1201 Blue Parrot Ct
- 1007 Howard Ave
- 1206 Sycamore Ct
- 9272 El Caminito
- 9402 Rodeo Dr
- 119 Farrell Ave
- 103 Farrell Ave
- 111 Farrell Ave
- 833 Welburn Ave
- 9555 Santa Teresa Blvd
- 741 Baxter Way
- 125 Bennett St
- 170 Sturla Way
- 722 Saint Clar Ave
- 9085 Kern Ave
- 732 Saint Clar Ave
- 9075 Kern Ave
- 713 Saint Clar Ave
- 9065 Kern Ave
- 723 Saint Clar Ave
- 733 Saint Clar Ave
- 9130 Kern Ave
- 9105 Kern Ave
- 743 Saint Clar Ave
- 680 Wickham Ct
- 9150 Kern Ave
- 9115 Kern Ave
- 726 Gascony Ct
- 9045 Kern Ave
- 9100 Avezan Way
- 736 Gascony Ct
- 9125 Kern Ave
- 716 Gascony Ct
Your Personal Tour Guide
Ask me questions while you tour the home.