M
Seller's Agent in 2024
Margaret Tiernan
Stuart Realty LLC

Estimated Value: $160,000 - $178,000
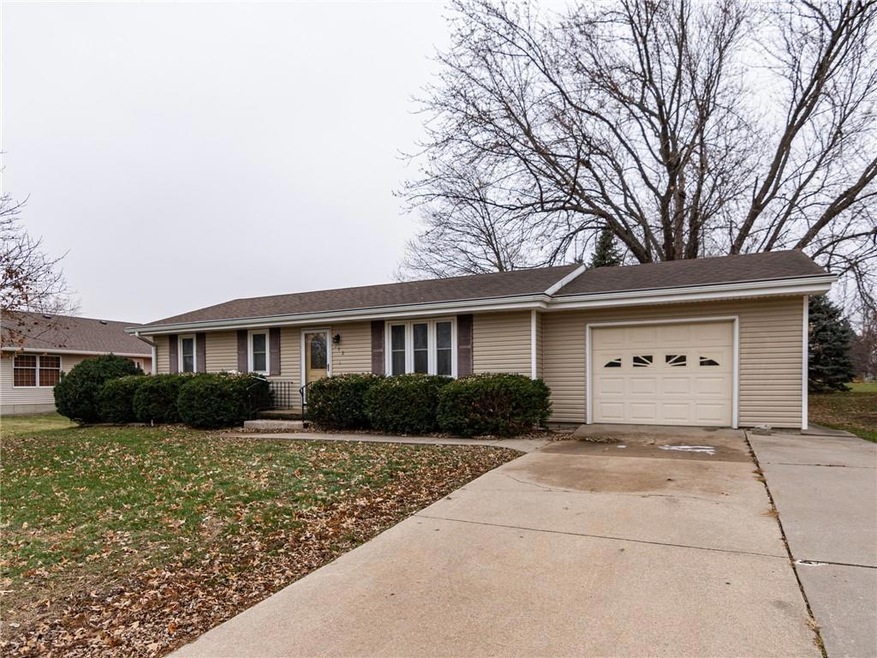
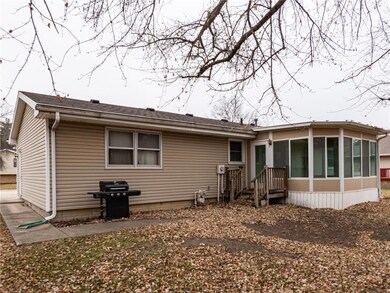
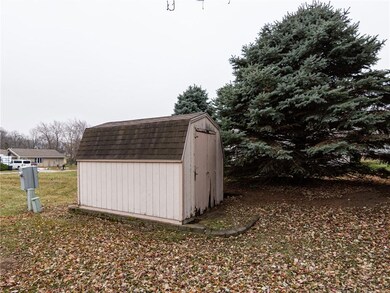
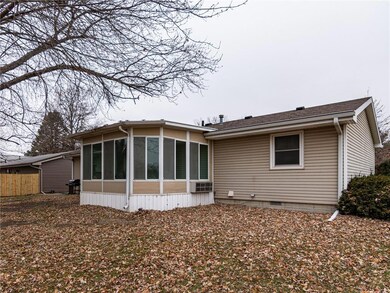
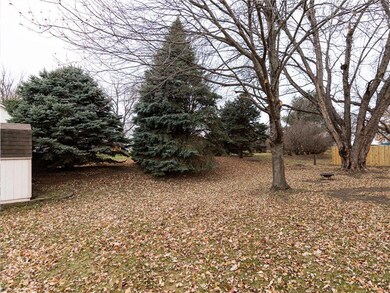
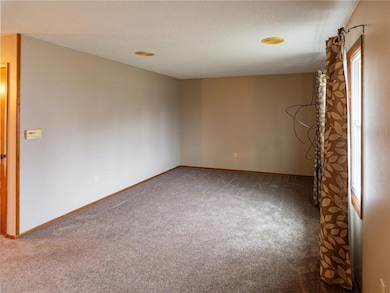
Cozy 2 BR home with extra 4 seasons room. Half basement approx. 480 sq. ft. House is heated by heat pump with forced air furnace. 1 car attached garage and shed in back. Plenty of closets, linen closet and coat closet. Appliances stay.
Last Agent to Sell the Property
Margaret Tiernan
Stuart Realty LLC Listed on: 08/20/2024
Last Buyer's Agent
Margaret Tiernan
Stuart Realty LLC Listed on: 08/20/2024
We collect this data history from publicly available records. To have your information removed, we recommend requesting removal directly through your county’s website.
We collect this data history from publicly available records. To have your information removed, we recommend requesting removal directly through your county’s website.
| Date | Buyer | Sale Price | Title Company |
|---|---|---|---|
| $150,000 | None Listed On Document | ||
| $150,000 | None Listed On Document | ||
| $74,000 | None Available |
We collect this data history from publicly available records. To have your information removed, we recommend requesting removal directly through your county’s website.
| Date | Event | Price | List to Sale | Price per Sq Ft |
|---|---|---|---|---|
| 12/26/2024 12/26/24 | Sold | $150,000 | -6.3% | $130 / Sq Ft |
| 11/30/2024 11/30/24 | Pending | -- | -- | -- |
| 10/15/2024 10/15/24 | Price Changed | $160,000 | -8.6% | $139 / Sq Ft |
| 08/20/2024 08/20/24 | For Sale | $175,000 | -- | $152 / Sq Ft |
We collect this data history from publicly available records. To have your information removed, we recommend requesting removal directly through your county’s website.
| Year | Tax Paid | Tax Assessment Tax Assessment Total Assessment is a certain percentage of the fair market value that is determined by local assessors to be the total taxable value of land and additions on the property. | Land | Improvement |
|---|---|---|---|---|
| 2025 | $2,108 | $151,730 | $23,860 | $127,870 |
| 2024 | $2,108 | $125,710 | $21,870 | $103,840 |
| 2023 | $1,870 | $125,710 | $21,870 | $103,840 |
| 2022 | $1,794 | $96,330 | $13,920 | $82,410 |
| 2021 | $1,794 | $96,330 | $13,920 | $82,410 |
| 2020 | $1,886 | $82,350 | $13,920 | $68,430 |
| 2019 | $1,902 | $0 | $0 | $0 |
| 2018 | $1,882 | $0 | $0 | $0 |
| 2017 | $1,882 | $76,895 | $0 | $0 |
| 2016 | $1,908 | $76,895 | $11,465 | $65,430 |
| 2015 | $1,980 | $89,748 | $0 | $0 |
| 2014 | $2,240 | $89,748 | $0 | $0 |
M
Seller's Agent in 2024
Margaret Tiernan
Stuart Realty LLC
Source: Des Moines Area Association of REALTORS®
MLS Number: 701426
APN: 04-05-202-004
Disclaimer: Certain information contained herein is derived from information provided by parties other than Homes.com. All information provided is deemed reliable, but is not guaranteed to be accurate and should be independently verified.
![]() IDX information is provided exclusively for personal, non-commercial use, and may not be used for any purpose other than to identify prospective properties consumers may be interested in purchasing. Information is deemed reliable but not guaranteed.
IDX information is provided exclusively for personal, non-commercial use, and may not be used for any purpose other than to identify prospective properties consumers may be interested in purchasing. Information is deemed reliable but not guaranteed.
Ask me questions while you tour the home.
