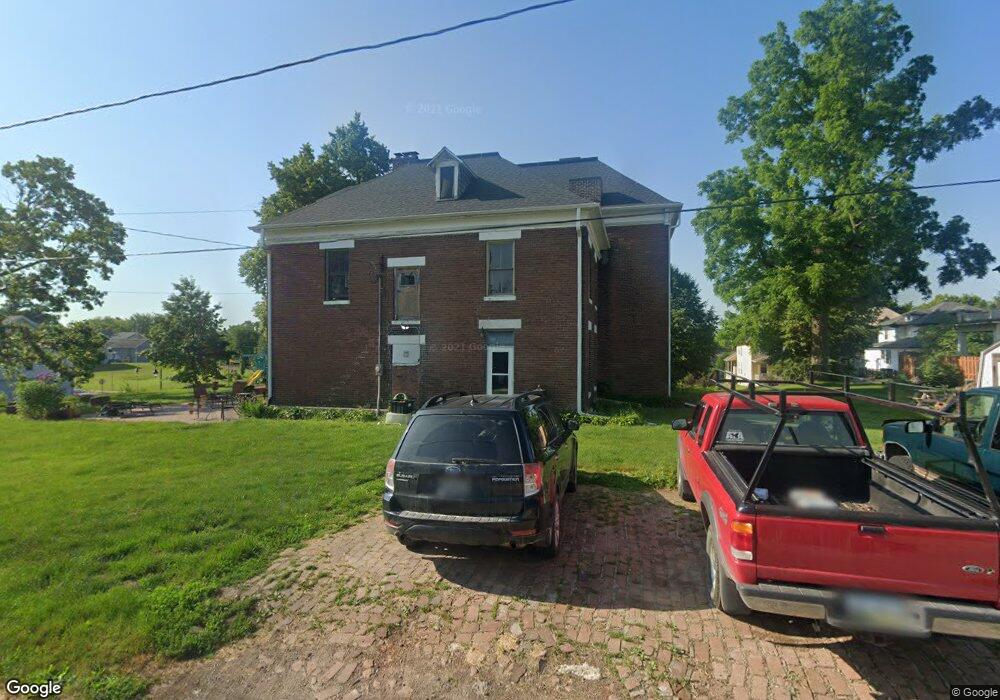
712 W 8th St Davenport, IA 52802
Central Davenport NeighborhoodEstimated Value: $272,000 - $305,000
6
Beds
3
Baths
5,094
Sq Ft
$58/Sq Ft
Est. Value
About This Home
This home is located at 712 W 8th St, Davenport, IA 52802 and is currently estimated at $293,112, approximately $57 per square foot. 712 W 8th St is a home located in Scott County with nearby schools including Walnut Hill Elementary School, Christian County Middle School, and Casey County Middle School.
Ownership History
Date
Name
Owned For
Owner Type
Purchase Details
Closed on
Apr 17, 2024
Sold by
Kuehl Adam James and Kuehl Alyssa
Bought by
Mcclean Matthew and Kloberdanz Ellen
Current Estimated Value
Purchase Details
Closed on
Jan 9, 2015
Sold by
Farnum Roy R and Farnum Cynthia A
Bought by
Kuehl Adam James and Kuehl Alyssa
Home Financials for this Owner
Home Financials are based on the most recent Mortgage that was taken out on this home.
Original Mortgage
$124,000
Interest Rate
3.87%
Mortgage Type
Adjustable Rate Mortgage/ARM
Purchase Details
Closed on
Jul 11, 2007
Sold by
French Willaim N and French Mary D
Bought by
Farnum Roy R and Farnum Cynthia A
Purchase Details
Closed on
Jun 27, 2005
Sold by
Farnum Cynthia A and Grayburn Cynthia A
Bought by
Farnum Roy R and Farnum Cynthia A
Create a Home Valuation Report for This Property
The Home Valuation Report is an in-depth analysis detailing your home's value as well as a comparison with similar homes in the area
Home Values in the Area
Average Home Value in this Area
Purchase History
| Date | Buyer | Sale Price | Title Company |
|---|---|---|---|
| Mcclean Matthew | $235,000 | None Listed On Document | |
| Kuehl Adam James | $130,000 | None Available | |
| Farnum Roy R | $2,000 | None Available | |
| Farnum Roy R | -- | None Available | |
| Farnum Roy R | $24,000 | None Available | |
| Smith Dana Jo | $20,000 | None Available |
Source: Public Records
Mortgage History
| Date | Status | Borrower | Loan Amount |
|---|---|---|---|
| Previous Owner | Kuehl Adam James | $124,000 |
Source: Public Records
Tax History Compared to Growth
Tax History
| Year | Tax Paid | Tax Assessment Tax Assessment Total Assessment is a certain percentage of the fair market value that is determined by local assessors to be the total taxable value of land and additions on the property. | Land | Improvement |
|---|---|---|---|---|
| 2025 | $4,590 | $280,360 | $28,090 | $252,270 |
| 2024 | $4,524 | $267,040 | $28,090 | $238,950 |
| 2023 | $3,534 | $267,040 | $28,090 | $238,950 |
| 2022 | $3,540 | $172,000 | $12,040 | $159,960 |
| 2021 | $3,490 | $171,600 | $12,040 | $159,560 |
| 2020 | $2,986 | $150,230 | $12,040 | $138,190 |
| 2019 | $3,082 | $135,120 | $12,040 | $123,080 |
| 2018 | $2,982 | $135,120 | $12,040 | $123,080 |
| 2017 | $2,836 | $133,480 | $12,040 | $121,440 |
| 2016 | $2,732 | $124,720 | $0 | $0 |
| 2015 | $2,732 | $114,870 | $0 | $0 |
| 2014 | $2,358 | $118,880 | $0 | $0 |
| 2013 | $2,400 | $0 | $0 | $0 |
| 2012 | -- | $105,720 | $21,210 | $84,510 |
Source: Public Records
Map
Nearby Homes