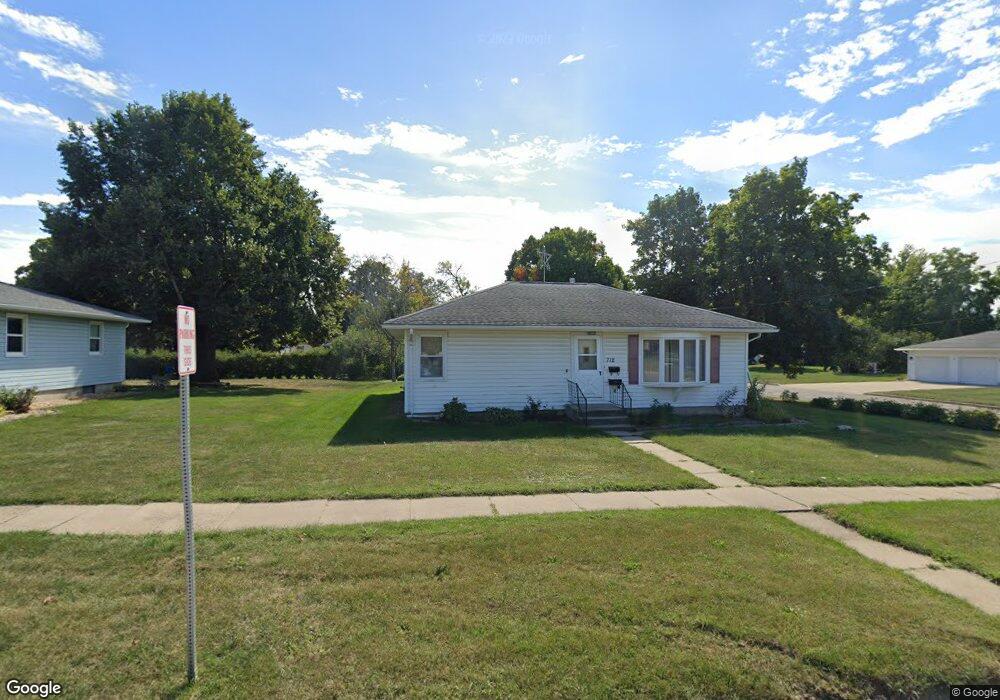
712 W 8th St Vinton, IA 52349
Estimated Value: $162,000 - $232,000
2
Beds
2
Baths
1,596
Sq Ft
$118/Sq Ft
Est. Value
About This Home
This home is located at 712 W 8th St, Vinton, IA 52349 and is currently estimated at $188,208, approximately $117 per square foot. 712 W 8th St is a home located in Benton County with nearby schools including Tilford Elementary School, Shellsburg Elementary School, and Vinton-Shellsburg Middle School.
Ownership History
Date
Name
Owned For
Owner Type
Purchase Details
Closed on
Jan 31, 2025
Sold by
Rundlett Dakota W and Reece-Rundlett Landra Jo
Bought by
Engledow Carilyn
Current Estimated Value
Purchase Details
Closed on
Sep 19, 2024
Sold by
Rundlett Dakota W
Bought by
Rundlett Dakota W and Reece Landra Jo
Home Financials for this Owner
Home Financials are based on the most recent Mortgage that was taken out on this home.
Original Mortgage
$73,000
Interest Rate
6.47%
Mortgage Type
Credit Line Revolving
Create a Home Valuation Report for This Property
The Home Valuation Report is an in-depth analysis detailing your home's value as well as a comparison with similar homes in the area
Home Values in the Area
Average Home Value in this Area
Purchase History
| Date | Buyer | Sale Price | Title Company |
|---|---|---|---|
| Engledow Carilyn | $205,000 | None Listed On Document | |
| Rundlett Dakota W | -- | None Listed On Document |
Source: Public Records
Mortgage History
| Date | Status | Borrower | Loan Amount |
|---|---|---|---|
| Previous Owner | Rundlett Dakota W | $73,000 |
Source: Public Records
Tax History Compared to Growth
Tax History
| Year | Tax Paid | Tax Assessment Tax Assessment Total Assessment is a certain percentage of the fair market value that is determined by local assessors to be the total taxable value of land and additions on the property. | Land | Improvement |
|---|---|---|---|---|
| 2025 | $2,824 | $166,300 | $15,500 | $150,800 |
| 2024 | $2,824 | $150,700 | $14,900 | $135,800 |
| 2023 | $2,624 | $150,700 | $14,900 | $135,800 |
| 2022 | $2,692 | $121,900 | $11,900 | $110,000 |
| 2021 | $2,692 | $121,900 | $11,900 | $110,000 |
| 2020 | $2,130 | $114,600 | $11,200 | $103,400 |
| 2019 | $1,964 | $98,400 | $11,200 | $87,200 |
| 2018 | $1,904 | $98,100 | $10,600 | $87,500 |
| 2017 | $1,824 | $98,100 | $10,600 | $87,500 |
| 2016 | $1,790 | $91,700 | $9,900 | $81,800 |
| 2015 | $1,790 | $91,700 | $9,900 | $81,800 |
| 2014 | $1,922 | $97,600 | $0 | $0 |
Source: Public Records
Map
Nearby Homes