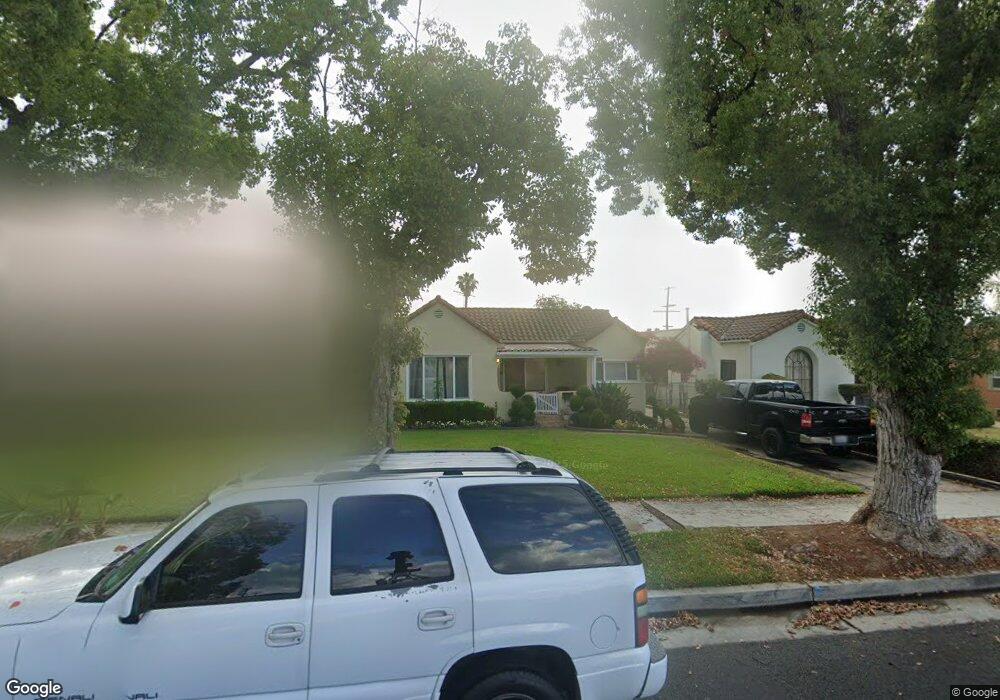
712 Westmont Dr Alhambra, CA 91803
Emery Park NeighborhoodEstimated Value: $858,000 - $1,163,000
2
Beds
1
Bath
1,112
Sq Ft
$872/Sq Ft
Est. Value
About This Home
This home is located at 712 Westmont Dr, Alhambra, CA 91803 and is currently estimated at $969,853, approximately $872 per square foot. 712 Westmont Dr is a home located in Los Angeles County with nearby schools including Emery Park Elementary School, Alhambra High School, and Bell Tower School.
Ownership History
Date
Name
Owned For
Owner Type
Purchase Details
Closed on
May 19, 2025
Sold by
Dedonato Alexis and Nguyen Andrew
Bought by
Nguyen Andrew
Current Estimated Value
Purchase Details
Closed on
Jan 2, 2019
Sold by
Dang Vickie
Bought by
Le Cang Trung
Home Financials for this Owner
Home Financials are based on the most recent Mortgage that was taken out on this home.
Original Mortgage
$380,000
Interest Rate
4.8%
Mortgage Type
New Conventional
Purchase Details
Closed on
Dec 31, 2018
Sold by
Nguyen Tam Thanh and Nguyen Connie Le
Bought by
Nguyen Andrew Anh
Home Financials for this Owner
Home Financials are based on the most recent Mortgage that was taken out on this home.
Original Mortgage
$380,000
Interest Rate
4.8%
Mortgage Type
New Conventional
Purchase Details
Closed on
May 12, 2009
Sold by
Tran Dang Thanh and Le Hoa Xuan
Bought by
Tran Dang Thanh and Le Hoa Xuan
Create a Home Valuation Report for This Property
The Home Valuation Report is an in-depth analysis detailing your home's value as well as a comparison with similar homes in the area
Home Values in the Area
Average Home Value in this Area
Purchase History
| Date | Buyer | Sale Price | Title Company |
|---|---|---|---|
| Nguyen Andrew | -- | None Listed On Document | |
| Le Cang Trung | -- | Wfg National Title Company | |
| Nguyen Andrew Anh | $570,000 | Wfg National Title Company | |
| Tran Dang Thanh | -- | None Available |
Source: Public Records
Mortgage History
| Date | Status | Borrower | Loan Amount |
|---|---|---|---|
| Previous Owner | Nguyen Andrew Anh | $380,000 |
Source: Public Records
Tax History Compared to Growth
Tax History
| Year | Tax Paid | Tax Assessment Tax Assessment Total Assessment is a certain percentage of the fair market value that is determined by local assessors to be the total taxable value of land and additions on the property. | Land | Improvement |
|---|---|---|---|---|
| 2025 | $7,983 | $635,843 | $507,560 | $128,283 |
| 2024 | $7,736 | $623,376 | $497,608 | $125,768 |
| 2023 | $7,643 | $611,153 | $487,851 | $123,302 |
| 2022 | $7,272 | $599,171 | $478,286 | $120,885 |
| 2021 | $7,197 | $587,423 | $468,908 | $118,515 |
| 2019 | $4,725 | $167,125 | $100,279 | $66,846 |
| 2018 | $2,337 | $163,849 | $98,313 | $65,536 |
| 2016 | $2,156 | $157,489 | $94,497 | $62,992 |
| 2015 | $2,125 | $155,124 | $93,078 | $62,046 |
| 2014 | $2,107 | $152,086 | $91,255 | $60,831 |
Source: Public Records
Map
Nearby Homes
- 601 Orange Grove Ave
- 657 S Meridian Ave
- 706 S Meridian Ave
- 5437 Norwich Ave
- 5436 Norwich Ave
- 3339 Dorchester Ave
- 228 Hampden Terrace
- 3202 Farnsworth Ave
- 5350 Oakland St
- 5390 Huntington Dr S
- 3216 Warwick Ave
- 2912 Covina St
- 5301 Huntington Dr N
- 3908 Edison Walk
- 4206 Lowell Ave
- 1417 Milton Ave
- 4211 Lowell Ave
- 5217 Navarro St
- 5160 Oakland St
- 4200 Barrett Rd
- 714 Westmont Dr
- 708 Westmont Dr
- 720 Westmont Dr
- 704 Westmont Dr
- 800 Westmont Dr
- 715 Winthrop Dr
- 709 Winthrop Dr
- 700 Westmont Dr
- 717 Winthrop Dr
- 705 Winthrop Dr
- 721 Winthrop Dr
- 804 Westmont Dr
- 610 Westmont Dr
- 801 Winthrop Dr
- 701 Winthrop Dr
- 715 Westmont Dr
- 711 Westmont Dr
- 717 Westmont Dr
- 808 Westmont Dr
- 721 Westmont Dr