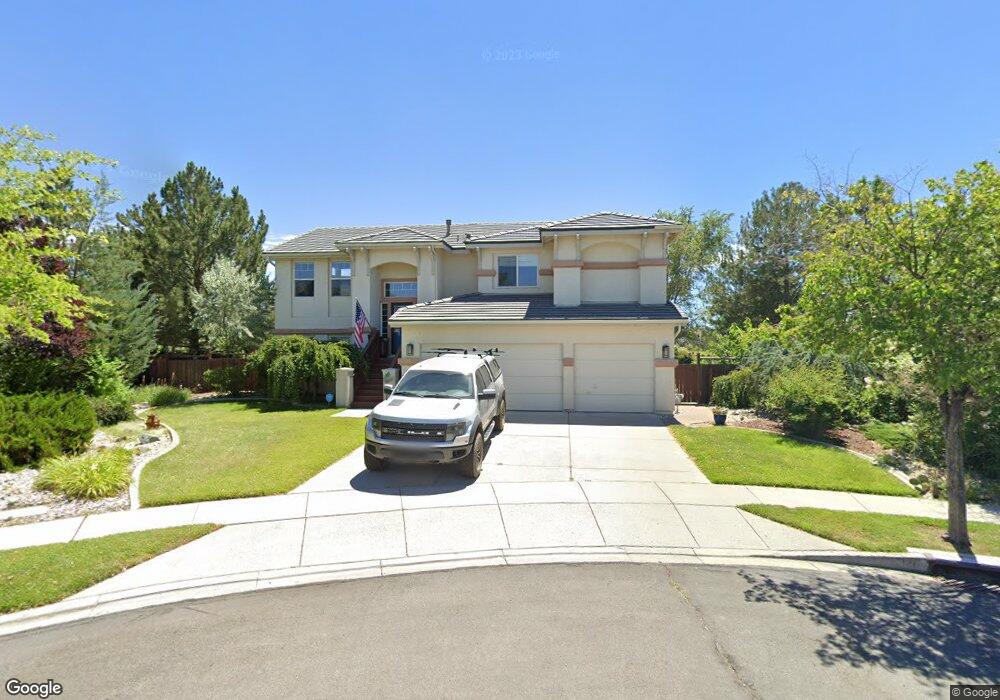
7121 Graymare Ct Sparks, NV 89436
Wingfield Springs NeighborhoodEstimated Value: $615,000 - $656,000
3
Beds
3
Baths
2,315
Sq Ft
$278/Sq Ft
Est. Value
About This Home
This home is located at 7121 Graymare Ct, Sparks, NV 89436 and is currently estimated at $642,719, approximately $277 per square foot. 7121 Graymare Ct is a home located in Washoe County with nearby schools including Van Gorder Elementary School, Sky Ranch Middle School, and Spanish Springs High School.
Ownership History
Date
Name
Owned For
Owner Type
Purchase Details
Closed on
Mar 17, 2020
Sold by
Riccabona Vincent J and Riccabona Nora G
Bought by
Aguilar Paul A and Aguilar Denise M
Current Estimated Value
Home Financials for this Owner
Home Financials are based on the most recent Mortgage that was taken out on this home.
Original Mortgage
$440,865
Outstanding Balance
$388,000
Interest Rate
3.4%
Mortgage Type
New Conventional
Estimated Equity
$254,719
Purchase Details
Closed on
Dec 6, 2001
Sold by
Doria John J and Doria Linda M
Bought by
Riccabona Vincent J and Riccabona Nora G
Home Financials for this Owner
Home Financials are based on the most recent Mortgage that was taken out on this home.
Original Mortgage
$129,000
Interest Rate
6.67%
Purchase Details
Closed on
Apr 29, 1997
Sold by
Silverado 140 Lp
Bought by
Doria John J and Doria Linda M
Home Financials for this Owner
Home Financials are based on the most recent Mortgage that was taken out on this home.
Original Mortgage
$227,750
Interest Rate
7.96%
Create a Home Valuation Report for This Property
The Home Valuation Report is an in-depth analysis detailing your home's value as well as a comparison with similar homes in the area
Home Values in the Area
Average Home Value in this Area
Purchase History
| Date | Buyer | Sale Price | Title Company |
|---|---|---|---|
| Aguilar Paul A | $454,500 | Western Title Company | |
| Riccabona Vincent J | $279,000 | First American Title | |
| Doria John J | $240,000 | First American Title Co |
Source: Public Records
Mortgage History
| Date | Status | Borrower | Loan Amount |
|---|---|---|---|
| Open | Aguilar Paul A | $440,865 | |
| Previous Owner | Riccabona Vincent J | $129,000 | |
| Previous Owner | Doria John J | $227,750 |
Source: Public Records
Tax History
| Year | Tax Paid | Tax Assessment Tax Assessment Total Assessment is a certain percentage of the fair market value that is determined by local assessors to be the total taxable value of land and additions on the property. | Land | Improvement |
|---|---|---|---|---|
| 2026 | $2,389 | $145,797 | $48,694 | $97,103 |
| 2025 | $3,110 | $147,868 | $48,694 | $99,175 |
| 2024 | $3,110 | $140,594 | $40,205 | $100,389 |
| 2023 | $3,020 | $135,843 | $40,793 | $95,051 |
| 2022 | $2,933 | $112,983 | $33,663 | $79,320 |
| 2021 | $2,849 | $108,890 | $29,768 | $79,122 |
| 2020 | $2,765 | $110,444 | $30,944 | $79,500 |
| 2019 | $2,582 | $106,542 | $28,996 | $77,546 |
| 2018 | $2,605 | $96,937 | $20,837 | $76,100 |
| 2017 | $2,533 | $95,964 | $19,588 | $76,376 |
| 2016 | $2,464 | $96,318 | $18,559 | $77,759 |
| 2015 | $2,461 | $85,349 | $16,170 | $69,179 |
| 2014 | $2,394 | $74,751 | $13,855 | $60,896 |
| 2013 | -- | $58,395 | $11,246 | $47,149 |
Source: Public Records
Map
Nearby Homes
- 7201 Silver King Dr
- 7240 Silver King Dr
- 7279 Silver King Dr
- 7214 Grand Island Dr
- 3686 Banfi Ct
- 6894 Cinnamon Dr
- 7045 Krug Dr
- 7610 Badelona Ct
- 3663 Copernicus Ct
- 3716 Early Dawn Dr
- 3094 Diamond Dust Ct
- 3747 Banfi Ct
- 7381 Silver King Dr
- 6726 Runnymede Dr
- 6790 Talmedge Cir
- 3647 Lepus Dr
- 6970 Rioja Ct
- 6713 Eagle Wing Cir
- 7058 Cinder Village Dr
- 3149 Gladiola Ct
- 7129 Graymare Ct
- 7113 Graymare Ct Unit 9C
- 7027 Whitemare Ct
- 7027 Whitemare Ct
- 7027 Whitemare Ct
- 7105 Graymare Ct
- 7137 Graymare Ct
- 7137 Gray Mare Ct
- 7019 Whitemare Ct
- 7043 Cinnamon Dr
- 7063 Cinnamon Dr
- 7163 Cinnamon Dr
- 7128 Cinnamon Dr
- 7116 Cinnamon Dr
- 7140 Cinnamon Dr
- 7104 Cinnamon Dr
- 7011 Whitemare Ct
- 7152 Cinnamon Dr Unit 9C
- 7092 Cinnamon Dr
- 7003 Whitemare Ct
Your Personal Tour Guide
Ask me questions while you tour the home.