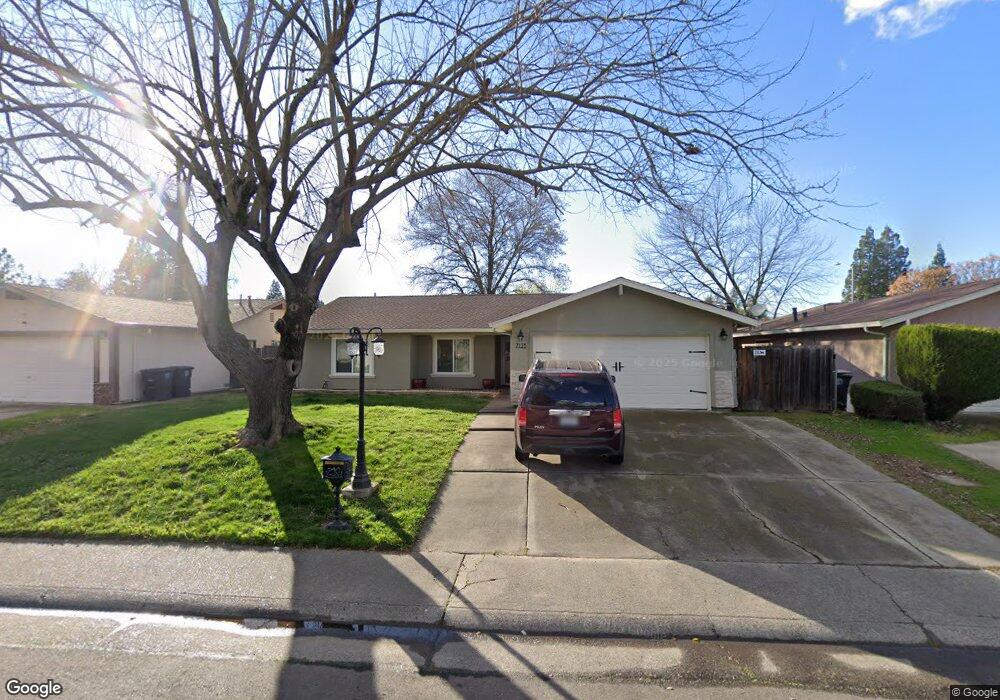
7123 Checkerbloom Way Citrus Heights, CA 95610
Estimated Value: $379,000 - $510,000
4
Beds
2
Baths
1,454
Sq Ft
$326/Sq Ft
Est. Value
About This Home
This home is located at 7123 Checkerbloom Way, Citrus Heights, CA 95610 and is currently estimated at $474,506, approximately $326 per square foot. 7123 Checkerbloom Way is a home located in Sacramento County with nearby schools including Trajan Elementary School, Louis Pasteur Fundamental Middle School, and Casa Roble Fundamental High School.
Ownership History
Date
Name
Owned For
Owner Type
Purchase Details
Closed on
Oct 19, 2004
Sold by
Fisher David I and Fisher Mary A
Bought by
Williams Robert L and Aldana Williams Letitia
Current Estimated Value
Home Financials for this Owner
Home Financials are based on the most recent Mortgage that was taken out on this home.
Original Mortgage
$239,999
Outstanding Balance
$111,633
Interest Rate
4.87%
Mortgage Type
Purchase Money Mortgage
Estimated Equity
$362,873
Purchase Details
Closed on
Feb 26, 2002
Sold by
Dyner Zakhar
Bought by
Fisher David L and Fisher Mary A
Home Financials for this Owner
Home Financials are based on the most recent Mortgage that was taken out on this home.
Original Mortgage
$132,400
Interest Rate
6.8%
Create a Home Valuation Report for This Property
The Home Valuation Report is an in-depth analysis detailing your home's value as well as a comparison with similar homes in the area
Home Values in the Area
Average Home Value in this Area
Purchase History
| Date | Buyer | Sale Price | Title Company |
|---|---|---|---|
| Williams Robert L | $300,000 | Financial Title Company | |
| Fisher David L | $165,500 | Financial Title Company |
Source: Public Records
Mortgage History
| Date | Status | Borrower | Loan Amount |
|---|---|---|---|
| Open | Williams Robert L | $239,999 | |
| Previous Owner | Fisher David L | $132,400 | |
| Closed | Williams Robert L | $44,999 |
Source: Public Records
Tax History Compared to Growth
Tax History
| Year | Tax Paid | Tax Assessment Tax Assessment Total Assessment is a certain percentage of the fair market value that is determined by local assessors to be the total taxable value of land and additions on the property. | Land | Improvement |
|---|---|---|---|---|
| 2025 | $4,862 | $418,155 | $132,414 | $285,741 |
| 2024 | $4,862 | $409,957 | $129,818 | $280,139 |
| 2023 | $4,737 | $401,920 | $127,273 | $274,647 |
| 2022 | $4,711 | $394,040 | $124,778 | $269,262 |
| 2021 | $4,631 | $386,315 | $122,332 | $263,983 |
| 2020 | $4,212 | $354,701 | $112,320 | $242,381 |
| 2019 | $3,968 | $334,625 | $105,963 | $228,662 |
| 2018 | $3,807 | $318,692 | $100,918 | $217,774 |
| 2017 | $3,458 | $287,111 | $90,918 | $196,193 |
| 2016 | $2,963 | $258,660 | $81,909 | $176,751 |
| 2015 | $2,734 | $239,501 | $75,842 | $163,659 |
| 2014 | $2,598 | $228,096 | $72,230 | $155,866 |
Source: Public Records
Map
Nearby Homes
- 8060 Hoopes Dr
- 7001 Checkerbloom Way
- 8057 Poulson St
- 7201 Canelo Hills Dr
- 7156 Melva St
- 7443 Heritage Meadow Place
- 8277 Rhodora Ct
- 7412 Fox Hills Dr
- 8205 Lash Larue Ln
- 7517 Quail Vista Ln
- 7135 Mathis Ct
- 7970 Larwin Dr
- 7504 Wooddale Way
- 8291 Central Ave
- 7429 Tiara Way
- 7963 Arcade Lake Ln
- 7977 Arcade Lake Ln Unit 81
- 8033 Arcade Lake Ln
- 7956 Antelope Rd
- 6736 Wyatt Cir
- 7119 Checkerbloom Way
- 7127 Checkerbloom Way
- 7113 Checkerbloom Way
- 8110 Poppyfield Way
- 7122 Checkerbloom Way
- 7118 Checkerbloom Way
- 7107 Checkerbloom Way
- 8099 Mcclung Dr
- 7112 Checkerbloom Way
- 8095 Mcclung Dr
- 8101 Poppyfield Way
- 8116 Poppyfield Way
- 8056 Copperwood Dr
- 8105 Poppyfield Way
- 8091 Mcclung Dr
- 7101 Checkerbloom Way
- 8111 Poppyfield Way
- 7106 Checkerbloom Way
- 7123 Forbs Way
- 7119 Forbs Way