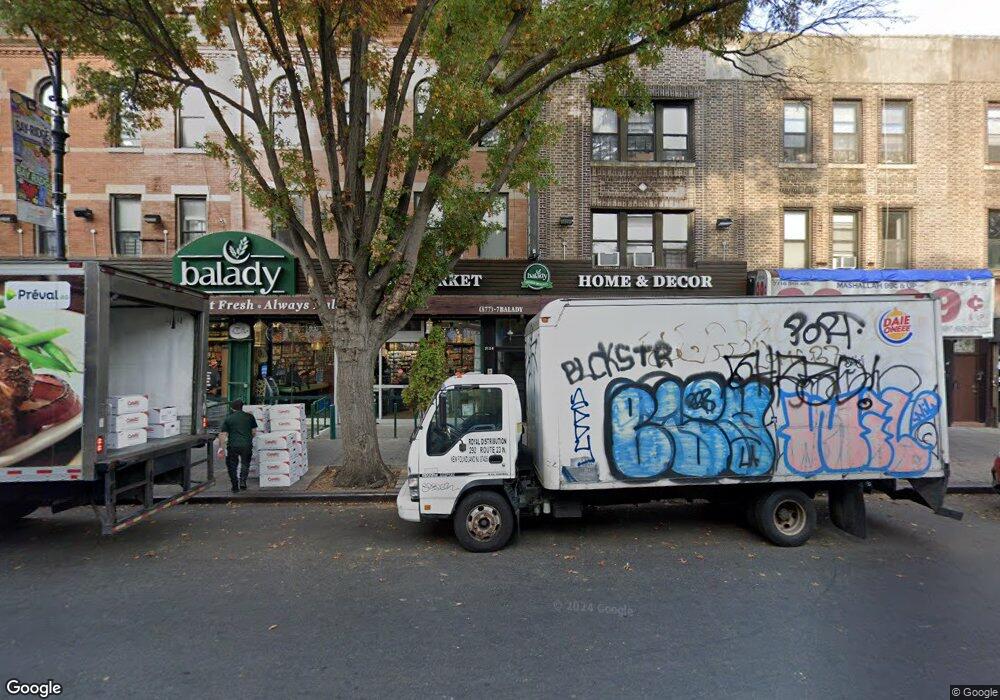
7124 5th Ave Bayridge, NY 11209
Bay Ridge NeighborhoodEstimated Value: $1,849,820
--
Bed
--
Bath
5,279
Sq Ft
$350/Sq Ft
Est. Value
About This Home
This home is located at 7124 5th Ave, Bayridge, NY 11209 and is currently estimated at $1,849,820, approximately $350 per square foot. 7124 5th Ave is a home located in Kings County with nearby schools including P.S./I.S. 30 - The Mary White Ovington School, Fort Hamilton High School, and Lutheran Elementary School Of Bay Ridge.
Ownership History
Date
Name
Owned For
Owner Type
Purchase Details
Closed on
Apr 18, 2007
Sold by
C & S Property Inc
Bought by
Masoud Bros Properties Llc
Current Estimated Value
Home Financials for this Owner
Home Financials are based on the most recent Mortgage that was taken out on this home.
Original Mortgage
$1,200,000
Outstanding Balance
$728,739
Interest Rate
6.23%
Mortgage Type
Commercial
Estimated Equity
$1,121,081
Purchase Details
Closed on
May 29, 1998
Sold by
Pucciarelli Frank and Pucciarelli Lawrence
Bought by
C & S Property Inc
Home Financials for this Owner
Home Financials are based on the most recent Mortgage that was taken out on this home.
Original Mortgage
$265,000
Interest Rate
6.98%
Mortgage Type
Seller Take Back
Create a Home Valuation Report for This Property
The Home Valuation Report is an in-depth analysis detailing your home's value as well as a comparison with similar homes in the area
Home Values in the Area
Average Home Value in this Area
Purchase History
| Date | Buyer | Sale Price | Title Company |
|---|---|---|---|
| Masoud Bros Properties Llc | $999,900 | -- | |
| Masoud Bros Properties Llc | $999,900 | -- | |
| C & S Property Inc | $400,000 | First American Title Ins Co | |
| C & S Property Inc | $400,000 | First American Title Ins Co |
Source: Public Records
Mortgage History
| Date | Status | Borrower | Loan Amount |
|---|---|---|---|
| Open | Masoud Bros Properties Llc | $1,200,000 | |
| Closed | Masoud Bros Properties Llc | $1,200,000 | |
| Previous Owner | C & S Property Inc | $265,000 |
Source: Public Records
Tax History Compared to Growth
Tax History
| Year | Tax Paid | Tax Assessment Tax Assessment Total Assessment is a certain percentage of the fair market value that is determined by local assessors to be the total taxable value of land and additions on the property. | Land | Improvement |
|---|---|---|---|---|
| 2025 | $45,566 | $500,400 | $60,300 | $440,100 |
| 2024 | $45,566 | $449,100 | $60,300 | $388,800 |
| 2023 | $43,324 | $416,700 | $60,300 | $356,400 |
| 2022 | $39,914 | $422,550 | $60,300 | $362,250 |
| 2021 | $37,144 | $389,250 | $60,300 | $328,950 |
| 2020 | $16,907 | $427,500 | $60,300 | $367,200 |
| 2019 | $35,360 | $358,020 | $60,300 | $297,720 |
| 2018 | $36,468 | $275,686 | $55,719 | $219,967 |
| 2017 | $32,467 | $255,265 | $129,482 | $125,783 |
| 2016 | $30,471 | $236,357 | $128,364 | $107,993 |
| 2015 | $18,966 | $200,032 | $141,750 | $58,282 |
| 2014 | $18,966 | $213,427 | $91,843 | $121,584 |
Source: Public Records
Map
Nearby Homes
- 7127 5th Ave
- 7129 5th Ave
- 460 Ovington Ave Unit 3G
- 540 Ovington Ave
- 515 73rd St
- 523 73rd St
- 450 73rd St
- 545 72nd St
- 522 Bay Ridge Ave
- 438 73rd St
- 474 Bay Ridge Ave
- 561 72nd St
- 558 72nd St
- 571 72nd St
- 434 74th St
- 418 Bay Ridge Pkwy
- 7401 4th Ave Unit E9
- 7401 4th Ave Unit C4
- 7401 4th Ave Unit B1
- 7401 4th Ave Unit E7
- 7124 5th Ave Unit 2R
- 7124 5th Ave Unit 3L
- 7124 5th Ave Unit 3R
- 7124 5th Ave Unit 2R
- 7124 5th Ave Unit 2L
- 7118 5th Ave
- 7128 5th Ave
- 7128 5th Ave Unit 3L
- 7128 5th Ave Unit 2L
- 7116 5th Ave
- 7130 5th Ave
- 7114 5th Ave
- 7134 5th Ave
- 7112 5th Ave
- 7112 5th Ave Unit 3
- 475 72nd St
- 475 72nd St Unit 2
- 473 72nd St
- 471 72nd St
- 7104 5th Ave