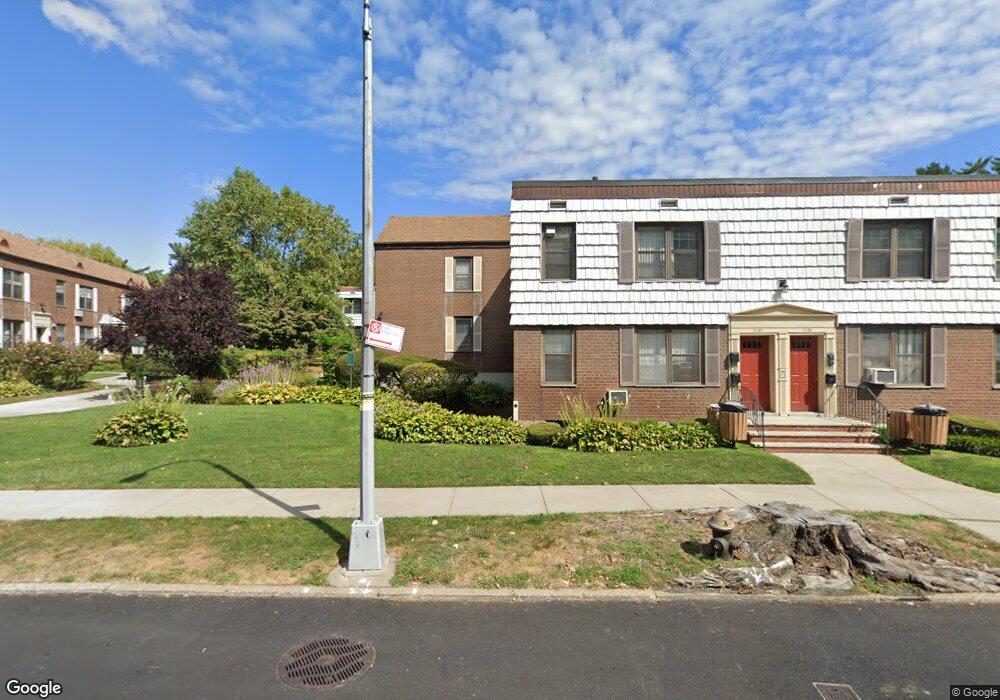
7125 Park Dr E Unit B Flushing, NY 11367
Kew Gardens Hills NeighborhoodEstimated Value: $364,095 - $434,000
1
Bed
1
Bath
635
Sq Ft
$628/Sq Ft
Est. Value
About This Home
This home is located at 7125 Park Dr E Unit B, Flushing, NY 11367 and is currently estimated at $399,024, approximately $628 per square foot. 7125 Park Dr E Unit B is a home located in Queens County with nearby schools including P.S. 164 - Queens Valley, I.S. 250 - The Robert F. Kennedy Community Middle School, and Yeshiva Of Central Queens.
Ownership History
Date
Name
Owned For
Owner Type
Purchase Details
Closed on
Sep 24, 2014
Sold by
Lee Damian
Bought by
Gu Joseph and Xu Bai Hua
Current Estimated Value
Home Financials for this Owner
Home Financials are based on the most recent Mortgage that was taken out on this home.
Original Mortgage
$175,000
Outstanding Balance
$133,776
Interest Rate
4.1%
Mortgage Type
New Conventional
Estimated Equity
$265,248
Purchase Details
Closed on
Jun 25, 2007
Sold by
Soriano Josie M
Bought by
Lee Damian
Home Financials for this Owner
Home Financials are based on the most recent Mortgage that was taken out on this home.
Original Mortgage
$57,680
Interest Rate
6.39%
Purchase Details
Closed on
May 17, 2002
Sold by
Pizzarelli Jennie
Bought by
Soriano Josie M
Home Financials for this Owner
Home Financials are based on the most recent Mortgage that was taken out on this home.
Original Mortgage
$129,620
Interest Rate
6.25%
Mortgage Type
Purchase Money Mortgage
Create a Home Valuation Report for This Property
The Home Valuation Report is an in-depth analysis detailing your home's value as well as a comparison with similar homes in the area
Home Values in the Area
Average Home Value in this Area
Purchase History
| Date | Buyer | Sale Price | Title Company |
|---|---|---|---|
| Gu Joseph | $250,000 | -- | |
| Gu Joseph | $250,000 | -- | |
| Lee Damian | $288,700 | -- | |
| Lee Damian | $288,700 | -- | |
| Soriano Josie M | -- | -- | |
| Soriano Josie M | -- | -- |
Source: Public Records
Mortgage History
| Date | Status | Borrower | Loan Amount |
|---|---|---|---|
| Open | Gu Joseph | $175,000 | |
| Closed | Gu Joseph | $175,000 | |
| Previous Owner | Lee Damian | $57,680 | |
| Previous Owner | Lee Damian | $230,720 | |
| Previous Owner | Soriano Josie M | $129,620 |
Source: Public Records
Tax History Compared to Growth
Tax History
| Year | Tax Paid | Tax Assessment Tax Assessment Total Assessment is a certain percentage of the fair market value that is determined by local assessors to be the total taxable value of land and additions on the property. | Land | Improvement |
|---|---|---|---|---|
| 2025 | $2,953 | $24,520 | $4,011 | $20,509 |
| 2024 | $2,953 | $23,618 | $4,011 | $19,607 |
| 2023 | $3,057 | $24,450 | $4,011 | $20,439 |
| 2022 | $2,948 | $24,305 | $4,011 | $20,294 |
| 2021 | $2,788 | $22,731 | $4,011 | $18,720 |
| 2020 | $2,768 | $25,637 | $4,011 | $21,626 |
| 2019 | $2,622 | $24,884 | $4,011 | $20,873 |
| 2018 | $2,468 | $19,405 | $4,011 | $15,394 |
| 2017 | $2,354 | $18,506 | $4,010 | $14,496 |
| 2016 | $2,308 | $18,506 | $4,010 | $14,496 |
| 2015 | $1,264 | $17,129 | $4,011 | $13,118 |
| 2014 | $1,264 | $16,300 | $4,002 | $12,298 |
Source: Public Records
Map
Nearby Homes
- 70-47 Park Dr E Unit A
- 69-92 136th St Unit A
- 70-07 Park Dr E Unit A
- 6951 136th St Unit 2A
- 69-51 136th St Unit 1A
- 135-23 Jewel Ave Unit A
- 13625 Jewel Ave Unit A
- 6958 138th St Unit A
- 68-76 136th St Unit A
- 13635 Jewel Ave Unit B
- 68- 58 136th St Unit B
- 138-29 Jewel Ave Unit 2D
- 6915 136th St Unit A
- 141-36 71st Rd
- 138-53 Jewel Ave Unit B
- 138-55 Jewel Ave Unit 2nd Fl
- 6845 136th St Unit B
- 72-59 141st St
- 6824 136th St Unit A
- 138-37 Jewel Ave Unit 3B
- 7129 Park Dr E Unit 2 Fl
- 7129 Park Dr E
- 7129 Park Dr E Unit B
- 7129 Park Dr E Unit A
- 7127 Park Dr E Unit B
- 7127 Park Dr E Unit A
- 7125 Park Dr E Unit B
- 7125 Park Dr E Unit A
- 7127 Park Dr E
- 7129 Park Dr E Unit B
- 7129 Park Dr E
- 7127 Park Dr E Unit B
- 71-27 Park Dr E Unit B
- 71-25 Park Dr E Unit B
- 7123 Park Dr E Unit B
- 7123 Park Dr E Unit A
- 7123 Park Dr E Unit 2B
- 7121 Park Dr E Unit B
- 7121 Park Dr E Unit A
- 7121 Park Dr E