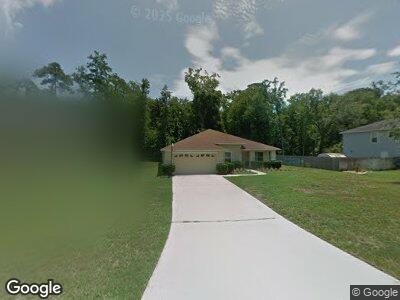
7125 Tarpon Ct Fleming Island, FL 32003
Estimated Value: $399,380 - $454,000
4
Beds
2
Baths
2,293
Sq Ft
$185/Sq Ft
Est. Value
About This Home
This home is located at 7125 Tarpon Ct, Fleming Island, FL 32003 and is currently estimated at $423,345, approximately $184 per square foot. 7125 Tarpon Ct is a home located in Clay County with nearby schools including Fleming Island High School, Robert M. Paterson Elementary School, and Green Cove Springs Junior High School.
Ownership History
Date
Name
Owned For
Owner Type
Purchase Details
Closed on
Sep 8, 2012
Sold by
Padgett James W
Bought by
Padgett Leslie Thill and Thill Leslie
Current Estimated Value
Purchase Details
Closed on
Feb 19, 2011
Sold by
Realty Capital Fund Lllp
Bought by
Padgett Leslie Thill and Padgett James W
Home Financials for this Owner
Home Financials are based on the most recent Mortgage that was taken out on this home.
Original Mortgage
$155,336
Interest Rate
4.95%
Mortgage Type
Purchase Money Mortgage
Purchase Details
Closed on
Apr 30, 2005
Sold by
Salzman Harry A and Klein Florence R
Bought by
Realty Capital Fund Lllp
Purchase Details
Closed on
May 28, 2004
Sold by
Kb Home Jacksonville Llc
Bought by
Salzman Harry A and Klein Florence R
Home Financials for this Owner
Home Financials are based on the most recent Mortgage that was taken out on this home.
Original Mortgage
$155,664
Interest Rate
5.89%
Mortgage Type
Purchase Money Mortgage
Create a Home Valuation Report for This Property
The Home Valuation Report is an in-depth analysis detailing your home's value as well as a comparison with similar homes in the area
Home Values in the Area
Average Home Value in this Area
Purchase History
| Date | Buyer | Sale Price | Title Company |
|---|---|---|---|
| Padgett Leslie Thill | -- | None Available | |
| Padgett Leslie Thill | $149,900 | Attorney | |
| Realty Capital Fund Lllp | $155,700 | -- | |
| Salzman Harry A | $194,600 | Associated Land Title Group |
Source: Public Records
Mortgage History
| Date | Status | Borrower | Loan Amount |
|---|---|---|---|
| Open | Padgett Leslie Thill | $153,000 | |
| Previous Owner | Padgett Leslie Thill | $155,336 | |
| Previous Owner | Salzman Harry A | $155,664 |
Source: Public Records
Tax History Compared to Growth
Tax History
| Year | Tax Paid | Tax Assessment Tax Assessment Total Assessment is a certain percentage of the fair market value that is determined by local assessors to be the total taxable value of land and additions on the property. | Land | Improvement |
|---|---|---|---|---|
| 2024 | $2,213 | $168,768 | -- | -- |
| 2023 | $2,213 | $163,853 | $0 | $0 |
| 2022 | $2,031 | $159,081 | $0 | $0 |
| 2021 | $2,022 | $154,448 | $0 | $0 |
| 2020 | $1,956 | $152,316 | $0 | $0 |
| 2019 | $1,925 | $148,892 | $0 | $0 |
| 2018 | $1,763 | $146,116 | $0 | $0 |
| 2017 | $1,751 | $143,111 | $0 | $0 |
| 2016 | $1,746 | $140,167 | $0 | $0 |
| 2015 | $1,795 | $139,193 | $0 | $0 |
| 2014 | $1,750 | $138,088 | $0 | $0 |
Source: Public Records
Map
Nearby Homes
- 925 Hibernia Forest Dr
- 861 Hibernia Forest Dr
- 835 Hibernia Forest Dr
- 120 Oakwood Plantation Dr
- 686 Frederic Dr
- 116 Oakwood Plantation Dr
- 1804 Eagle Crest Dr
- 1008 Clay St
- 573 Hagans Ct
- 1025 Fleming St
- 2479 Pinehurst Ln
- 2714 Berryhill Rd
- 2710 Berryhill Rd
- 1605 Vineland Cir Unit B
- 1259 Fleming St
- 618 Hibernia Oaks Dr
- 2574 Whispering Pines Dr
- 1127 Florida St
- 1350 Fleming St
- 959 Florida St
- 7125 Tarpon Ct
- 7121 Tarpon Ct
- 7129 Tarpon Ct
- 7133 Tarpon Ct
- 7122 Tarpon Ct
- 7126 Tarpon Ct
- 7531 Tarpon
- 7118 Tarpon Ct
- 7118 Tarpon
- 756 Georges
- 7130 Tarpon Ct
- 756 Georges Place
- 7137 Tarpon Ct
- 7114 Tarpon Ct
- 753 Georges Place
- 1264 Sailfish Ln
- 746 Georges Place
- 7138 Tarpon Ct
- 7141 Tarpon Ct
- 7110 Tarpon Ct