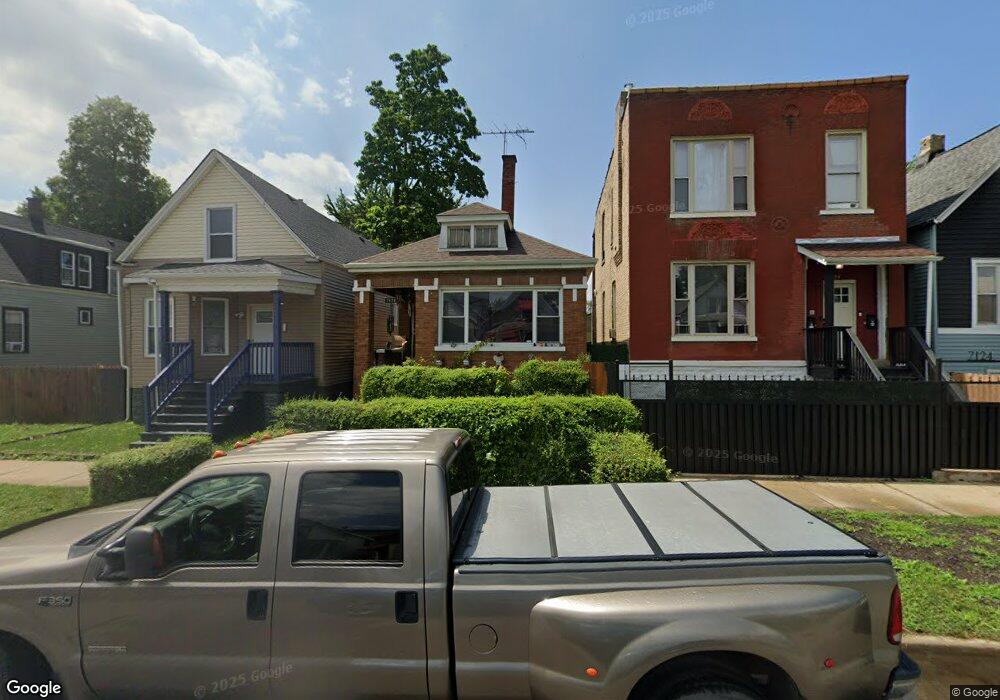
7126 S May St Chicago, IL 60621
Englewood NeighborhoodEstimated Value: $95,000 - $169,000
3
Beds
1
Bath
1,042
Sq Ft
$122/Sq Ft
Est. Value
About This Home
This home is located at 7126 S May St, Chicago, IL 60621 and is currently estimated at $126,990, approximately $121 per square foot. 7126 S May St is a home located in Cook County with nearby schools including Bond Elementary School.
Ownership History
Date
Name
Owned For
Owner Type
Purchase Details
Closed on
Nov 19, 1999
Sold by
Myers Dennis and Lewis Jammie L
Bought by
Myers Dennis
Current Estimated Value
Home Financials for this Owner
Home Financials are based on the most recent Mortgage that was taken out on this home.
Original Mortgage
$50,250
Interest Rate
7.9%
Purchase Details
Closed on
Apr 5, 1995
Sold by
Burks Madge Brenda and Burks James Vivian
Bought by
Myers Dennis and Lewis Jammie L
Home Financials for this Owner
Home Financials are based on the most recent Mortgage that was taken out on this home.
Original Mortgage
$47,500
Interest Rate
8.79%
Purchase Details
Closed on
Feb 21, 1994
Sold by
Jones Willie C
Bought by
Jones Brent M
Create a Home Valuation Report for This Property
The Home Valuation Report is an in-depth analysis detailing your home's value as well as a comparison with similar homes in the area
Home Values in the Area
Average Home Value in this Area
Purchase History
| Date | Buyer | Sale Price | Title Company |
|---|---|---|---|
| Myers Dennis | -- | -- | |
| Myers Dennis | $50,000 | -- | |
| Jones Brent M | -- | -- |
Source: Public Records
Mortgage History
| Date | Status | Borrower | Loan Amount |
|---|---|---|---|
| Closed | Myers Dennis | $50,250 | |
| Closed | Myers Dennis | $47,500 |
Source: Public Records
Tax History
| Year | Tax Paid | Tax Assessment Tax Assessment Total Assessment is a certain percentage of the fair market value that is determined by local assessors to be the total taxable value of land and additions on the property. | Land | Improvement |
|---|---|---|---|---|
| 2025 | $250 | $5,601 | $938 | $4,663 |
| 2024 | $250 | $5,601 | $938 | $4,663 |
| 2023 | $222 | $4,500 | $2,031 | $2,469 |
| 2022 | $222 | $4,500 | $2,031 | $2,469 |
| 2021 | $235 | $4,499 | $2,031 | $2,468 |
| 2020 | $634 | $5,947 | $2,343 | $3,604 |
| 2019 | $639 | $6,608 | $2,343 | $4,265 |
| 2018 | $627 | $6,608 | $2,343 | $4,265 |
| 2017 | $1,417 | $9,960 | $2,031 | $7,929 |
| 2016 | $1,495 | $9,960 | $2,031 | $7,929 |
| 2015 | $1,344 | $9,960 | $2,031 | $7,929 |
| 2014 | $1,014 | $8,036 | $1,875 | $6,161 |
| 2013 | $983 | $8,036 | $1,875 | $6,161 |
Source: Public Records
Map
Nearby Homes
- 7144 S May St
- 7128 S May St
- 1234 W 72nd St
- 7132 S Carpenter St
- 7137 S Carpenter St
- 7300 S Racine Ave
- 1257 W 72nd Place
- 7041 S Throop St
- 1275 W 71st St
- 7022 S Elizabeth St
- 7318 S Aberdeen St
- 7019 S Throop St
- 6953 S Elizabeth St
- 6944 S Racine Ave
- 7329 S Carpenter St
- 7331 S Carpenter St
- 7157 S Sangamon St
- 7007 S Ada St
- 7233 S Sangamon St
- 6946 S Throop St
Your Personal Tour Guide
Ask me questions while you tour the home.