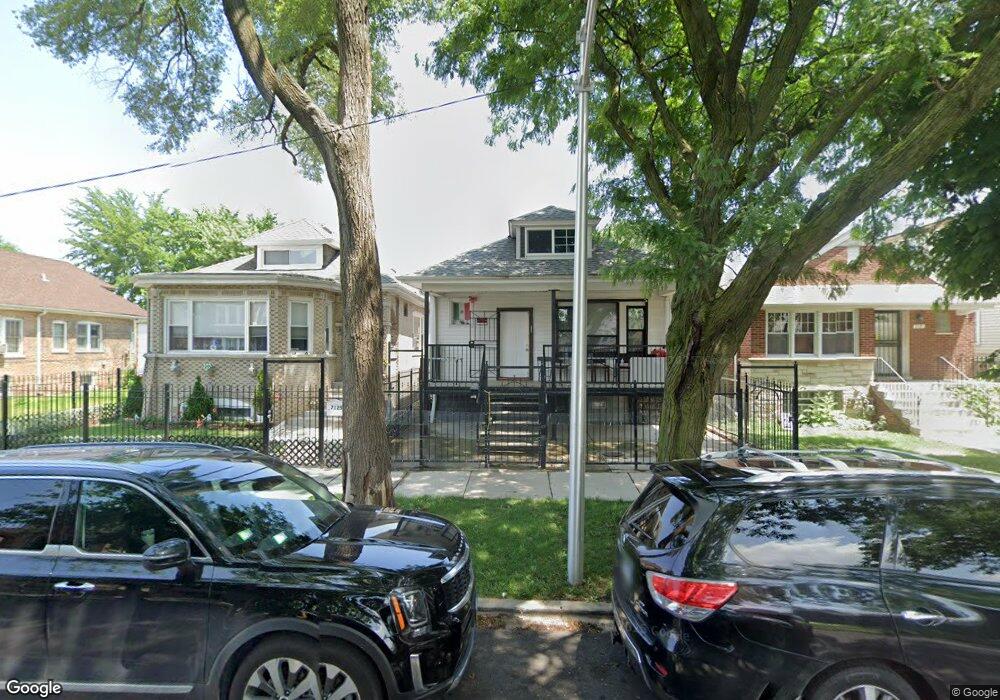
7127 S Talman Ave Chicago, IL 60629
Marquette Park NeighborhoodEstimated Value: $190,000 - $235,582
2
Beds
2
Baths
1,008
Sq Ft
$202/Sq Ft
Est. Value
About This Home
This home is located at 7127 S Talman Ave, Chicago, IL 60629 and is currently estimated at $203,646, approximately $202 per square foot. 7127 S Talman Ave is a home located in Cook County with nearby schools including McKay Elementary School, Gage Park High School, and Catalyst Maria Charter School.
Ownership History
Date
Name
Owned For
Owner Type
Purchase Details
Closed on
Aug 30, 2014
Sold by
Antillon Guadalupe
Bought by
Abeja Sofia and Abeja Guadalupe
Current Estimated Value
Purchase Details
Closed on
Oct 17, 2013
Sold by
Arnosa Group Llc
Bought by
Antillon Guedalupe
Purchase Details
Closed on
Jan 5, 2011
Sold by
Hsbc Bank Usa Na
Bought by
Arnosa Group Llc
Purchase Details
Closed on
Feb 16, 2010
Sold by
Price Jerome
Bought by
Hsbc Bank Usa Na
Purchase Details
Closed on
Jun 30, 2005
Sold by
Bowens Pamela
Bought by
Price Jerome
Home Financials for this Owner
Home Financials are based on the most recent Mortgage that was taken out on this home.
Original Mortgage
$104,000
Interest Rate
6.74%
Mortgage Type
Unknown
Purchase Details
Closed on
Sep 29, 1994
Sold by
Phillips Investments Inc
Bought by
Bowens Pamela
Home Financials for this Owner
Home Financials are based on the most recent Mortgage that was taken out on this home.
Original Mortgage
$49,600
Interest Rate
8.64%
Mortgage Type
FHA
Create a Home Valuation Report for This Property
The Home Valuation Report is an in-depth analysis detailing your home's value as well as a comparison with similar homes in the area
Home Values in the Area
Average Home Value in this Area
Purchase History
We collect this data history from publicly available records. To have your information removed, we recommend requesting removal directly through your county’s website.
| Date | Buyer | Sale Price | Title Company |
|---|---|---|---|
| Abeja Sofia | -- | None Available | |
| Antillon Guedalupe | $500 | None Available | |
| Arnosa Group Llc | -- | None Available | |
| Hsbc Bank Usa Na | -- | None Available | |
| Price Jerome | $130,000 | Atg Search | |
| Bowens Pamela | $50,000 | -- |
Source: Public Records
Mortgage History
We collect this data history from publicly available records. To have your information removed, we recommend requesting removal directly through your county’s website.
| Date | Status | Borrower | Loan Amount |
|---|---|---|---|
| Previous Owner | Price Jerome | $104,000 | |
| Previous Owner | Bowens Pamela | $49,600 |
Source: Public Records
Tax History
| Year | Tax Paid | Tax Assessment Tax Assessment Total Assessment is a certain percentage of the fair market value that is determined by local assessors to be the total taxable value of land and additions on the property. | Land | Improvement |
|---|---|---|---|---|
| 2025 | $2,054 | $19,000 | $1,890 | $17,110 |
| 2024 | $2,054 | $19,000 | $1,890 | $17,110 |
| 2023 | $1,982 | $13,000 | $3,024 | $9,976 |
| 2022 | $1,982 | $13,000 | $3,024 | $9,976 |
| 2021 | $2,614 | $13,000 | $3,024 | $9,976 |
| 2020 | $2,091 | $9,324 | $3,024 | $6,300 |
| 2019 | $2,095 | $10,361 | $3,024 | $7,337 |
| 2018 | $2,060 | $10,361 | $3,024 | $7,337 |
| 2017 | $2,708 | $11,834 | $2,646 | $9,188 |
| 2016 | $2,515 | $11,834 | $2,646 | $9,188 |
| 2015 | $2,307 | $11,834 | $2,646 | $9,188 |
| 2014 | $1,941 | $9,811 | $2,457 | $7,354 |
| 2013 | $1,906 | $9,811 | $2,457 | $7,354 |
Source: Public Records
Map
Nearby Homes
- 7230 S Talman Ave
- 7000 S Rockwell St
- 7116 S Artesian Ave
- 7321 S Rockwell St
- 6933 S Washtenaw Ave
- 6928 S Maplewood Ave
- 7118 S Mozart St
- 2641 W 69th St
- 7255 S Artesian Ave
- 7317 S Mozart St
- 2456 W Lithuanian Plaza Ct
- 6832 S Maplewood Ave
- 6825 S Rockwell St
- 7252 S Francisco Ave
- 6805 S Talman Ave
- 7448 S Maplewood Ave
- 2252 W 71st St
- 6734 S Maplewood Ave
- 6929 S Oakley Ave
- 6733 S Maplewood Ave
- 7131 S Talman Ave
- 7125 S Talman Ave
- 7133 S Talman Ave
- 7121 S Talman Ave
- 7137 S Talman Ave
- 7119 S Talman Ave
- 7139 S Talman Ave
- 7115 S Talman Ave
- 7130 S Rockwell St
- 7124 S Rockwell St Unit 1
- 7124 S Rockwell St
- 7143 S Talman Ave
- 7132 S Rockwell St
- 7126 S Rockwell St
- 7136 S Rockwell St
- 7118 S Rockwell St
- 7120 S Rockwell St
- 7124 S Talman Ave
- 7145 S Talman Ave
- 7145 S Talman Ave
Your Personal Tour Guide
Ask me questions while you tour the home.