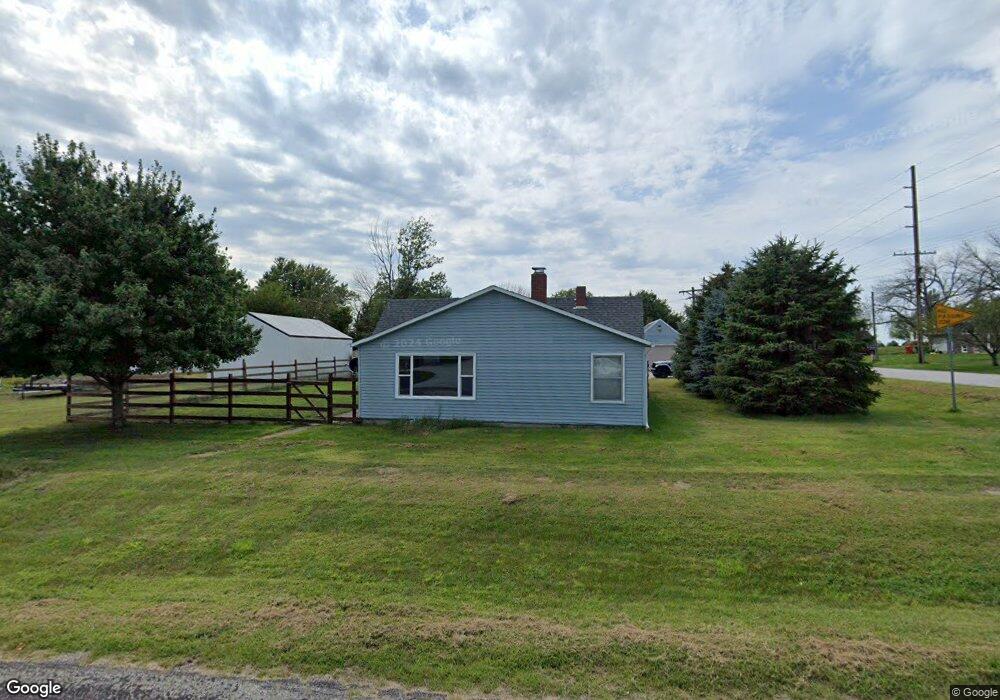
713 3rd Ave Collins, IA 50055
Estimated Value: $123,000 - $161,000
3
Beds
1
Bath
1,260
Sq Ft
$110/Sq Ft
Est. Value
About This Home
This home is located at 713 3rd Ave, Collins, IA 50055 and is currently estimated at $138,874, approximately $110 per square foot. 713 3rd Ave is a home located in Story County with nearby schools including Collins-Maxwell Elementary School and Collins-Maxwell Middle/High School.
Ownership History
Date
Name
Owned For
Owner Type
Purchase Details
Closed on
Jan 19, 2007
Sold by
Wright James W and Wright Hazel M
Bought by
Daniel Jeffrey S
Current Estimated Value
Home Financials for this Owner
Home Financials are based on the most recent Mortgage that was taken out on this home.
Original Mortgage
$55,000
Outstanding Balance
$41,955
Interest Rate
12%
Mortgage Type
Adjustable Rate Mortgage/ARM
Estimated Equity
$96,919
Create a Home Valuation Report for This Property
The Home Valuation Report is an in-depth analysis detailing your home's value as well as a comparison with similar homes in the area
Home Values in the Area
Average Home Value in this Area
Purchase History
| Date | Buyer | Sale Price | Title Company |
|---|---|---|---|
| Daniel Jeffrey S | $55,000 | -- |
Source: Public Records
Mortgage History
| Date | Status | Borrower | Loan Amount |
|---|---|---|---|
| Open | Daniel Jeffrey S | $55,000 |
Source: Public Records
Tax History Compared to Growth
Tax History
| Year | Tax Paid | Tax Assessment Tax Assessment Total Assessment is a certain percentage of the fair market value that is determined by local assessors to be the total taxable value of land and additions on the property. | Land | Improvement |
|---|---|---|---|---|
| 2025 | $1,478 | $89,500 | $20,200 | $69,300 |
| 2024 | $1,496 | $83,500 | $17,700 | $65,800 |
| 2023 | $1,404 | $83,500 | $17,700 | $65,800 |
| 2022 | $1,432 | $65,900 | $15,200 | $50,700 |
| 2021 | $1,374 | $65,900 | $15,200 | $50,700 |
| 2020 | $1,340 | $59,900 | $12,600 | $47,300 |
| 2019 | $1,340 | $59,900 | $12,600 | $47,300 |
| 2018 | $1,242 | $57,100 | $15,200 | $41,900 |
| 2017 | $1,242 | $57,100 | $15,200 | $41,900 |
| 2016 | $1,008 | $52,400 | $15,200 | $37,200 |
| 2015 | $1,008 | $52,400 | $15,200 | $37,200 |
| 2014 | $1,006 | $51,700 | $15,200 | $36,500 |
Source: Public Records
Map
Nearby Homes