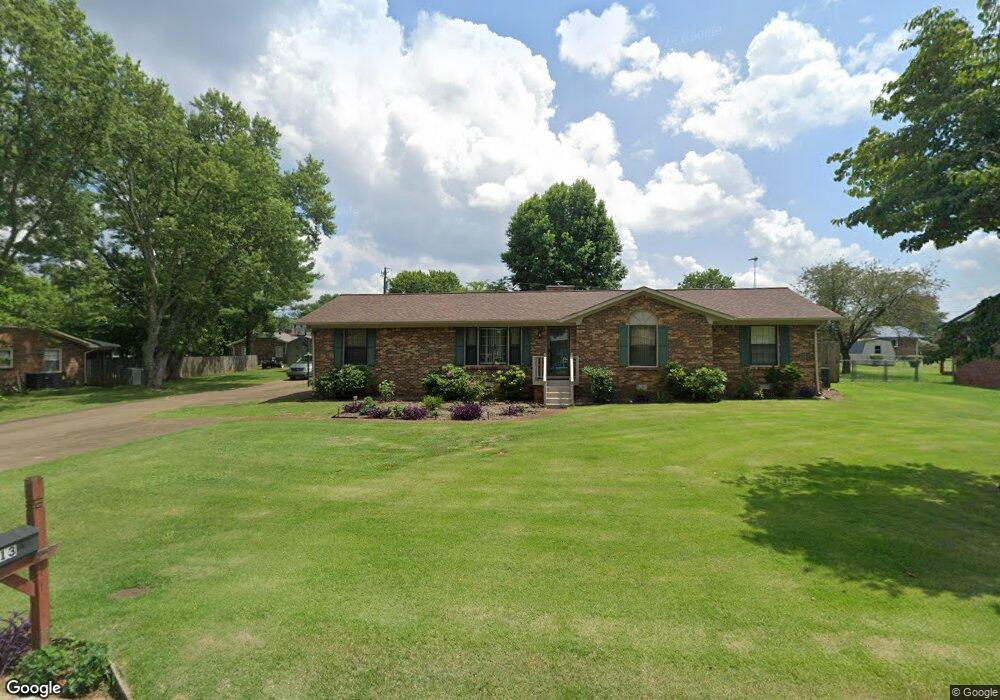
713 4th St Lawrenceburg, TN 38464
Estimated Value: $251,717 - $314,000
--
Bed
2
Baths
1,759
Sq Ft
$160/Sq Ft
Est. Value
About This Home
This home is located at 713 4th St, Lawrenceburg, TN 38464 and is currently estimated at $281,429, approximately $159 per square foot. 713 4th St is a home located in Lawrence County with nearby schools including Ingram Sowell Elementary School, Lawrenceburg Public Elementary School, and David Crockett Elementary School.
Ownership History
Date
Name
Owned For
Owner Type
Purchase Details
Closed on
May 12, 2017
Sold by
Seay Marsha
Bought by
Burke Clayton and Burke Sharon E
Current Estimated Value
Purchase Details
Closed on
Oct 15, 2003
Sold by
Will Kenneth L and Will Elaine R
Bought by
James Seay
Purchase Details
Closed on
Oct 14, 2003
Bought by
Seay James and Seay Marsha
Purchase Details
Closed on
Apr 28, 1980
Bought by
Will Kenneth L and Will Elaine
Purchase Details
Closed on
Jan 2, 1980
Purchase Details
Closed on
Jan 1, 1980
Create a Home Valuation Report for This Property
The Home Valuation Report is an in-depth analysis detailing your home's value as well as a comparison with similar homes in the area
Home Values in the Area
Average Home Value in this Area
Purchase History
| Date | Buyer | Sale Price | Title Company |
|---|---|---|---|
| Burke Clayton | $129,900 | -- | |
| James Seay | $11,200 | -- | |
| Seay James | $112,000 | -- | |
| Will Kenneth L | -- | -- | |
| -- | $45,500 | -- | |
| -- | $49,700 | -- |
Source: Public Records
Tax History Compared to Growth
Tax History
| Year | Tax Paid | Tax Assessment Tax Assessment Total Assessment is a certain percentage of the fair market value that is determined by local assessors to be the total taxable value of land and additions on the property. | Land | Improvement |
|---|---|---|---|---|
| 2025 | $1,382 | $44,450 | $0 | $0 |
| 2024 | $1,382 | $44,450 | $3,750 | $40,700 |
| 2023 | $1,382 | $44,450 | $3,750 | $40,700 |
| 2022 | $1,382 | $44,450 | $3,750 | $40,700 |
| 2021 | $1,333 | $30,325 | $2,500 | $27,825 |
| 2020 | $1,333 | $30,325 | $2,500 | $27,825 |
| 2019 | $1,333 | $30,325 | $2,500 | $27,825 |
| 2018 | $1,333 | $30,325 | $2,500 | $27,825 |
| 2017 | $1,365 | $30,325 | $2,500 | $27,825 |
| 2016 | $1,365 | $31,075 | $2,500 | $28,575 |
| 2015 | $1,293 | $31,075 | $2,500 | $28,575 |
| 2014 | $1,208 | $29,025 | $2,500 | $26,525 |
Source: Public Records
Map
Nearby Homes