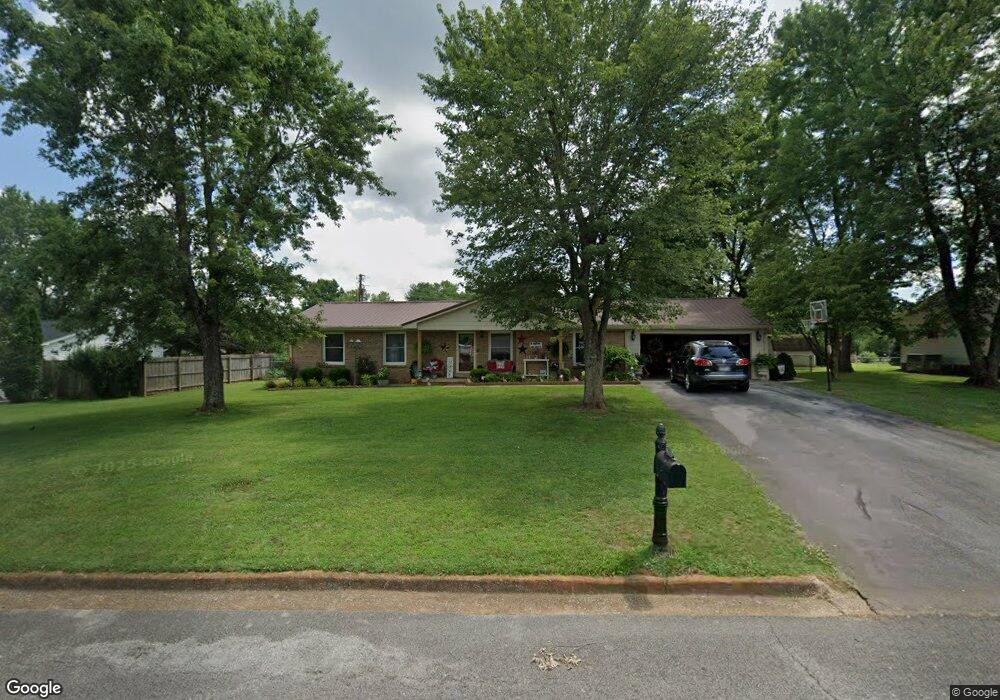
713 5th St Lawrenceburg, TN 38464
Estimated Value: $220,261 - $281,000
--
Bed
2
Baths
1,610
Sq Ft
$156/Sq Ft
Est. Value
About This Home
This home is located at 713 5th St, Lawrenceburg, TN 38464 and is currently estimated at $250,815, approximately $155 per square foot. 713 5th St is a home located in Lawrence County with nearby schools including Ingram Sowell Elementary School, Lawrenceburg Public Elementary School, and David Crockett Elementary School.
Ownership History
Date
Name
Owned For
Owner Type
Purchase Details
Closed on
Jul 14, 2009
Sold by
Singleton Gary
Bought by
Faulkner Sheila Dianne
Current Estimated Value
Purchase Details
Closed on
Aug 26, 2007
Sold by
Joe Chapman
Bought by
Gary Singleton
Purchase Details
Closed on
Jun 25, 2007
Sold by
Alberta Clayton
Bought by
Gary Singleton
Home Financials for this Owner
Home Financials are based on the most recent Mortgage that was taken out on this home.
Original Mortgage
$50,000
Interest Rate
6.35%
Purchase Details
Closed on
Apr 30, 2003
Sold by
Jane Mcintrye Martha
Bought by
Bailey Mcintrye Helen
Purchase Details
Closed on
Aug 4, 1997
Sold by
Alberta Clayton
Bought by
Kathy Pollock
Home Financials for this Owner
Home Financials are based on the most recent Mortgage that was taken out on this home.
Original Mortgage
$100,000
Interest Rate
7.65%
Purchase Details
Closed on
Aug 8, 1980
Bought by
Clayton Alberta
Purchase Details
Closed on
Jan 2, 1900
Create a Home Valuation Report for This Property
The Home Valuation Report is an in-depth analysis detailing your home's value as well as a comparison with similar homes in the area
Home Values in the Area
Average Home Value in this Area
Purchase History
| Date | Buyer | Sale Price | Title Company |
|---|---|---|---|
| Faulkner Sheila Dianne | $96,500 | -- | |
| Gary Singleton | -- | -- | |
| Gary Singleton | $70,000 | -- | |
| Bailey Mcintrye Helen | -- | -- | |
| Kathy Pollock | $100,000 | -- | |
| Clayton Alberta | -- | -- | |
| -- | -- | -- |
Source: Public Records
Mortgage History
| Date | Status | Borrower | Loan Amount |
|---|---|---|---|
| Previous Owner | Not Available | $50,000 | |
| Previous Owner | Not Available | $100,000 |
Source: Public Records
Tax History Compared to Growth
Tax History
| Year | Tax Paid | Tax Assessment Tax Assessment Total Assessment is a certain percentage of the fair market value that is determined by local assessors to be the total taxable value of land and additions on the property. | Land | Improvement |
|---|---|---|---|---|
| 2025 | $1,357 | $43,650 | $0 | $0 |
| 2024 | $1,357 | $43,650 | $3,750 | $39,900 |
| 2023 | $1,357 | $43,650 | $3,750 | $39,900 |
| 2022 | $1,357 | $43,650 | $3,750 | $39,900 |
| 2021 | $1,098 | $24,975 | $2,500 | $22,475 |
| 2020 | $1,098 | $24,975 | $2,500 | $22,475 |
| 2019 | $1,098 | $24,975 | $2,500 | $22,475 |
| 2018 | $1,098 | $24,975 | $2,500 | $22,475 |
| 2017 | $1,098 | $24,975 | $2,500 | $22,475 |
| 2016 | $1,098 | $24,975 | $2,500 | $22,475 |
| 2015 | $1,039 | $24,975 | $2,500 | $22,475 |
| 2014 | $985 | $23,675 | $2,500 | $21,175 |
Source: Public Records
Map
Nearby Homes