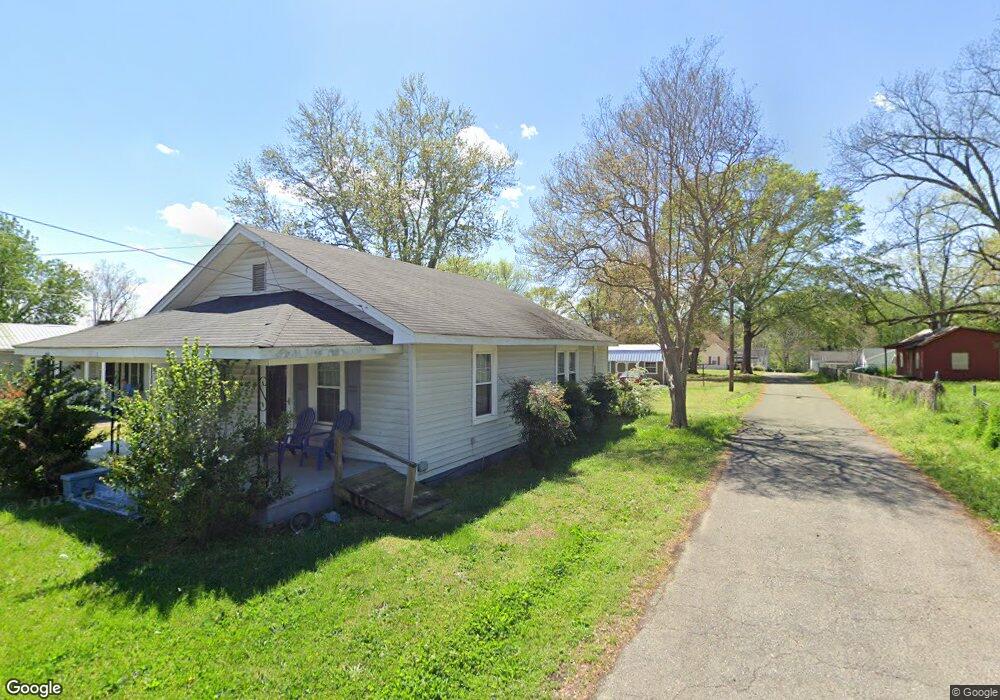
713 9th St Gaffney, SC 29340
Estimated Value: $115,528 - $168,000
2
Beds
1
Bath
1,200
Sq Ft
$115/Sq Ft
Est. Value
About This Home
This home is located at 713 9th St, Gaffney, SC 29340 and is currently estimated at $137,632, approximately $114 per square foot. 713 9th St is a home located in Cherokee County with nearby schools including Luther L. Vaughan Elementary School, Gaffney Middle School, and Gaffney High School.
Ownership History
Date
Name
Owned For
Owner Type
Purchase Details
Closed on
Apr 8, 2020
Sold by
Walton Jane M
Bought by
Blackwell Robert Jeffrey
Current Estimated Value
Home Financials for this Owner
Home Financials are based on the most recent Mortgage that was taken out on this home.
Original Mortgage
$63,822
Outstanding Balance
$57,675
Interest Rate
4.75%
Mortgage Type
FHA
Estimated Equity
$79,957
Purchase Details
Closed on
Feb 16, 2020
Sold by
Walton Jane M
Bought by
Blackwell Robert Jeffrey
Home Financials for this Owner
Home Financials are based on the most recent Mortgage that was taken out on this home.
Original Mortgage
$63,822
Outstanding Balance
$57,675
Interest Rate
4.75%
Mortgage Type
FHA
Estimated Equity
$79,957
Purchase Details
Closed on
Mar 18, 2019
Sold by
Parker Vickie B
Bought by
Walton Jane M
Purchase Details
Closed on
Sep 6, 2018
Sold by
Arthur Vanparker
Bought by
Parker Vickie B and Parker Jennifer Leanne
Create a Home Valuation Report for This Property
The Home Valuation Report is an in-depth analysis detailing your home's value as well as a comparison with similar homes in the area
Home Values in the Area
Average Home Value in this Area
Purchase History
| Date | Buyer | Sale Price | Title Company |
|---|---|---|---|
| Blackwell Robert Jeffrey | $65,000 | Defede John A | |
| Blackwell Robert Jeffrey | $65,000 | Defede John A | |
| Walton Jane M | $55,000 | -- | |
| Parker Vickie B | -- | -- | |
| Parker Vickie B | $3,846 | -- |
Source: Public Records
Mortgage History
| Date | Status | Borrower | Loan Amount |
|---|---|---|---|
| Open | Blackwell Robert Jeffrey | $63,822 | |
| Previous Owner | Blackwell Robert Jeffrey | $63,822 |
Source: Public Records
Tax History
| Year | Tax Paid | Tax Assessment Tax Assessment Total Assessment is a certain percentage of the fair market value that is determined by local assessors to be the total taxable value of land and additions on the property. | Land | Improvement |
|---|---|---|---|---|
| 2025 | $1,301 | $3,790 | $480 | $3,310 |
| 2024 | $1,235 | $3,790 | $480 | $3,310 |
| 2023 | $1,231 | $3,790 | $480 | $3,310 |
| 2022 | $1,167 | $3,790 | $480 | $3,310 |
| 2021 | $1,093 | $3,570 | $480 | $3,090 |
| 2020 | $1,057 | $3,530 | $0 | $0 |
| 2019 | $245 | $3,530 | $0 | $0 |
| 2018 | $245 | $2,350 | $0 | $0 |
| 2017 | $231 | $2,170 | $0 | $0 |
| 2016 | $242 | $2,170 | $0 | $0 |
| 2015 | $182 | $2,170 | $0 | $0 |
| 2014 | $182 | $2,170 | $0 | $0 |
| 2013 | $182 | $2,170 | $0 | $0 |
Source: Public Records
Map
Nearby Homes
- 205 Filter Plant Rd
- 202 Spruce St
- 400 Chatham Ave
- 402 Elm St
- 304 Elm St
- 131 Montpelier St
- 99 Walnut St
- 207 Magnolia St
- 607 Filter Plant Rd
- 205 Magnolia St
- 120 Crestmont Dr
- 421 Colonial Ave
- 103 Walnut St
- 202 River Dr
- 407 Willow St
- 107 Short Aly
- 500 Holly St
- 502 Beech St
- 121 Holland St
- 117 Lockhart Ln
Your Personal Tour Guide
Ask me questions while you tour the home.