
Seller's Agent in 2022
Brandy Siner
Goldie Locks Realty LLC
(337) 296-5362
3 in this area
490 Total Sales


Estimated Value: $65,000 - $67,000
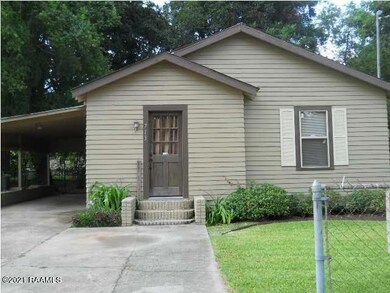
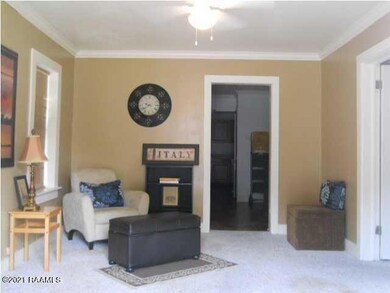
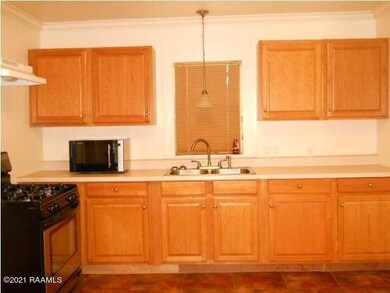
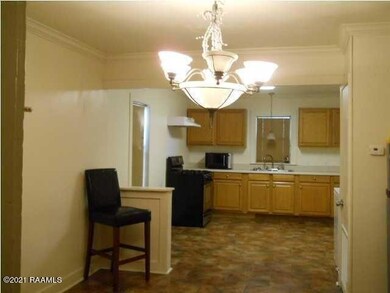
As is sale. Seller will not make any repairs!!!!Cash or conventional only. Pics are from 10 years ago. Buyer must pay for utilities for any and all inspections.
Last Agent to Sell the Property
Goldie Locks Realty LLC License #995694931 Listed on: 09/20/2021
| Date | Buyer | Sale Price | Title Company |
|---|---|---|---|
| Baker Jason P | $60,000 | None Listed On Document | |
| Duhon Sydney Adam | $80,000 | None Available | |
| Double Down Properties Llc | $220,000 | None Available |
| Date | Status | Borrower | Loan Amount |
|---|---|---|---|
| Previous Owner | Duhon Sydney Adam | $64,960 |
| Date | Event | Price | List to Sale | Price per Sq Ft |
|---|---|---|---|---|
| 02/24/2022 02/24/22 | Sold | -- | -- | -- |
| 02/03/2022 02/03/22 | Pending | -- | -- | -- |
| 09/20/2021 09/20/21 | For Sale | $69,999 | -- | $65 / Sq Ft |
| Year | Tax Paid | Tax Assessment Tax Assessment Total Assessment is a certain percentage of the fair market value that is determined by local assessors to be the total taxable value of land and additions on the property. | Land | Improvement |
|---|---|---|---|---|
| 2024 | $670 | $6,364 | $814 | $5,550 |
| 2023 | $670 | $6,364 | $814 | $5,550 |
| 2022 | $666 | $6,364 | $814 | $5,550 |
| 2021 | $774 | $7,374 | $814 | $6,560 |
| 2020 | $772 | $7,374 | $814 | $6,560 |
| 2019 | $608 | $7,374 | $814 | $6,560 |
| 2018 | $753 | $7,374 | $814 | $6,560 |
| 2017 | $752 | $7,374 | $814 | $6,560 |
| 2015 | $281 | $2,760 | $500 | $2,260 |
| 2013 | -- | $2,760 | $500 | $2,260 |
Seller's Agent in 2022
Brandy Siner
Goldie Locks Realty LLC
(337) 296-5362
3 in this area
490 Total Sales
Buyer's Agent in 2022
Janell Doucet
PAR Realty, LLP
(337) 962-3637
1 in this area
25 Total Sales
Source: REALTOR® Association of Acadiana
MLS Number: 21008649
APN: 6068965
Disclaimer: Certain information contained herein is derived from information provided by parties other than Homes.com. All information provided is deemed reliable, but is not guaranteed to be accurate and should be independently verified.
![]() The data relating to real estate for sale on this web site comes in part from the IDX Program of the REALTOR® Association of Acadiana’ MLS. IDX information is provided exclusively for consumers' personal, non-commercial use and may not be used for any purpose other than to identify prospective properties consumers may be interested in purchasing. Information deemed reliable, but not guaranteed accurate.
The data relating to real estate for sale on this web site comes in part from the IDX Program of the REALTOR® Association of Acadiana’ MLS. IDX information is provided exclusively for consumers' personal, non-commercial use and may not be used for any purpose other than to identify prospective properties consumers may be interested in purchasing. Information deemed reliable, but not guaranteed accurate.