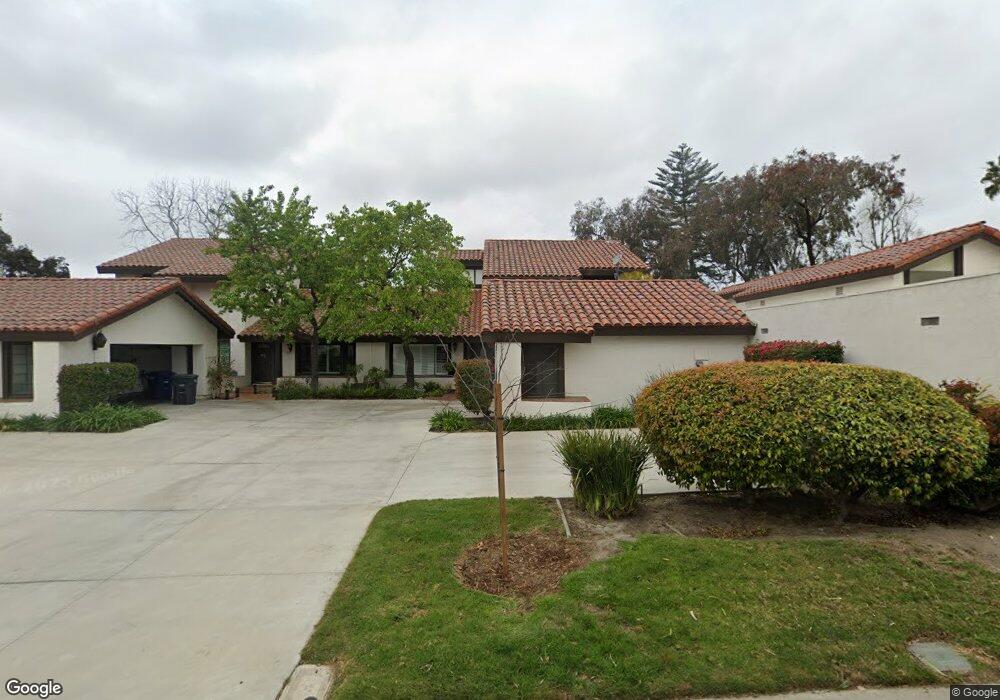
713 Camino Santa Barbara Solana Beach, CA 92075
Estimated Value: $1,972,000 - $2,373,000
4
Beds
3
Baths
2,470
Sq Ft
$863/Sq Ft
Est. Value
About This Home
This home is located at 713 Camino Santa Barbara, Solana Beach, CA 92075 and is currently estimated at $2,132,101, approximately $863 per square foot. 713 Camino Santa Barbara is a home located in San Diego County with nearby schools including Solana Vista Elementary School, Skyline Elementary School, and Earl Warren Middle School.
Ownership History
Date
Name
Owned For
Owner Type
Purchase Details
Closed on
Aug 19, 2010
Sold by
Walker William O and Walker Margaret R
Bought by
Walker William O and Walker Margaret R
Current Estimated Value
Purchase Details
Closed on
Jan 24, 2006
Sold by
Walker William O and Walker Margaret R
Bought by
Walker William O and Walker Margaret R
Purchase Details
Closed on
Dec 31, 2002
Sold by
Pearson Alvin J and Pearson Evelyn J
Bought by
Walker William O and Walker Margaret R
Home Financials for this Owner
Home Financials are based on the most recent Mortgage that was taken out on this home.
Original Mortgage
$431,200
Outstanding Balance
$181,619
Interest Rate
5.97%
Estimated Equity
$1,950,482
Purchase Details
Closed on
Mar 6, 2002
Sold by
Pearson Alvin J and Pearson Evelyn J
Bought by
A J & E J Pearson Trust
Create a Home Valuation Report for This Property
The Home Valuation Report is an in-depth analysis detailing your home's value as well as a comparison with similar homes in the area
Home Values in the Area
Average Home Value in this Area
Purchase History
| Date | Buyer | Sale Price | Title Company |
|---|---|---|---|
| Walker William O | -- | None Available | |
| Walker William O | -- | None Available | |
| Walker William O | -- | None Available | |
| Walker William O | -- | None Available | |
| Walker William O | $539,000 | United Title Company | |
| A J & E J Pearson Trust | -- | -- |
Source: Public Records
Mortgage History
| Date | Status | Borrower | Loan Amount |
|---|---|---|---|
| Open | Walker William O | $431,200 |
Source: Public Records
Tax History Compared to Growth
Tax History
| Year | Tax Paid | Tax Assessment Tax Assessment Total Assessment is a certain percentage of the fair market value that is determined by local assessors to be the total taxable value of land and additions on the property. | Land | Improvement |
|---|---|---|---|---|
| 2025 | $9,029 | $780,631 | $420,006 | $360,625 |
| 2024 | $8,807 | $765,325 | $411,771 | $353,554 |
| 2023 | $8,627 | $750,320 | $403,698 | $346,622 |
| 2022 | $8,499 | $735,609 | $395,783 | $339,826 |
| 2021 | $8,360 | $721,186 | $388,023 | $333,163 |
| 2020 | $8,292 | $713,792 | $384,045 | $329,747 |
| 2019 | $8,144 | $699,797 | $376,515 | $323,282 |
| 2018 | $7,985 | $686,077 | $369,133 | $316,944 |
| 2017 | $7,844 | $672,626 | $361,896 | $310,730 |
| 2016 | $7,392 | $659,438 | $354,800 | $304,638 |
| 2015 | $7,275 | $649,534 | $349,471 | $300,063 |
| 2014 | $7,124 | $636,812 | $342,626 | $294,186 |
Source: Public Records
Map
Nearby Homes
- 630 Camino Ynez
- 1155 Santa Luisa Dr
- 1108 Via Mil Cumbres
- 1015 Via Mil Cumbres
- 930 Via Mil Cumbres Unit 141
- 1110 Solana Dr
- 401 Santa Dominga
- 15027 Caminito Ladera
- 1240 Ladera Linda
- 4808 Sunny Acres Ln
- 1047 Highland Dr
- 14847 Vista Del Oceano
- 455 Glencrest Dr
- 524 Ford Ave
- 1046 America Way Unit 28
- 5306 Linea Del Cielo
- 15793 Caminito Cantaras
- 4397 Camino Privado
- 4540 Los Pinos
- 15390 Las Planideras
- 709 Camino Santa Barbara
- 717 Camino Santa Barbara
- 723 Camino Santa Barbara
- 718 Camino Santa Barbara
- 727 Camino Santa Barbara
- 714 Camino Santa Barbara
- 706 Camino Santa Barbara
- 710 Camino Santa Barbara
- 716 Camino Catalina
- 1502 Sun Valley Rd
- 720 Camino Catalina
- 731 Camino Santa Barbara
- 724 Camino Santa Barbara
- 625 Camino Santa Barbara
- 735 Camino Santa Barbara
- 628 Camino Catalina
- 728 Camino Santa Barbara
- 626 Camino Santa Barbara
- 624 Camino Catalina
- 732 Camino Santa Barbara