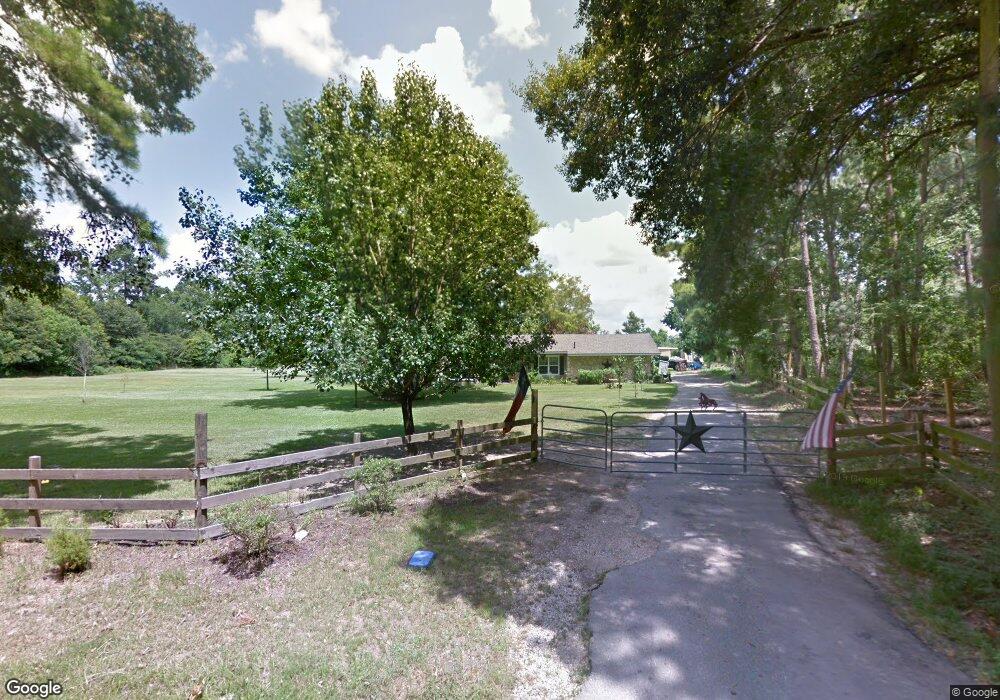
713 Carrell Rd Lufkin, TX 75901
Estimated Value: $248,000 - $342,000
--
Bed
8
Baths
2,812
Sq Ft
$104/Sq Ft
Est. Value
About This Home
This home is located at 713 Carrell Rd, Lufkin, TX 75901 and is currently estimated at $292,525, approximately $104 per square foot. 713 Carrell Rd is a home located in Angelina County with nearby schools including Slack Elementary School, Burley Primary School, and Lufkin Middle School.
Ownership History
Date
Name
Owned For
Owner Type
Purchase Details
Closed on
Aug 29, 2008
Sold by
Wheat Joe and Wheat Tonya
Bought by
Mcelroy Douglas P
Current Estimated Value
Home Financials for this Owner
Home Financials are based on the most recent Mortgage that was taken out on this home.
Original Mortgage
$214,515
Outstanding Balance
$143,053
Interest Rate
6.66%
Mortgage Type
New Conventional
Estimated Equity
$149,472
Create a Home Valuation Report for This Property
The Home Valuation Report is an in-depth analysis detailing your home's value as well as a comparison with similar homes in the area
Home Values in the Area
Average Home Value in this Area
Purchase History
| Date | Buyer | Sale Price | Title Company |
|---|---|---|---|
| Mcelroy Douglas P | $214,515 | Community Title |
Source: Public Records
Mortgage History
| Date | Status | Borrower | Loan Amount |
|---|---|---|---|
| Open | Mcelroy Douglas P | $214,515 |
Source: Public Records
Tax History Compared to Growth
Tax History
| Year | Tax Paid | Tax Assessment Tax Assessment Total Assessment is a certain percentage of the fair market value that is determined by local assessors to be the total taxable value of land and additions on the property. | Land | Improvement |
|---|---|---|---|---|
| 2025 | $3,291 | $208,060 | $36,880 | $171,180 |
| 2024 | $3,591 | $230,350 | $36,880 | $193,470 |
| 2023 | $3,115 | $227,060 | $36,880 | $190,180 |
| 2022 | $3,290 | $190,730 | $25,550 | $165,180 |
| 2021 | $3,296 | $188,770 | $25,550 | $163,220 |
| 2020 | $2,988 | $155,090 | $13,430 | $141,660 |
| 2019 | $3,207 | $155,090 | $13,430 | $141,660 |
| 2018 | $2,466 | $154,570 | $13,430 | $141,140 |
| 2017 | $2,466 | $149,480 | $13,430 | $136,050 |
| 2016 | $2,966 | $159,980 | $13,430 | $146,550 |
| 2015 | $3,191 | $159,980 | $13,430 | $146,550 |
| 2014 | $3,191 | $167,000 | $13,430 | $153,570 |
Source: Public Records
Map
Nearby Homes
- lot 1 Leslie Ln
- lot 3 Leslie Ln
- lot 2 Leslie Ln
- 165 Preston St
- R97410 Carrell Rd
- 132 Preston St
- 4515 Farm-To-market 841
- 0 Farm-To-market 841
- 4311 Farm-To-market 841
- ID 13148 Farm-To-market 841
- 3749 Fm 841
- 4685 Farm-To-market 841
- 4695 Farm-To-market 841
- 13.29 acres Joyce Ln
- TBD Irving Dr
- Lot 11 Shady Elm
- 410 S Medford Dr
- 106 Oakwood Dr
- 1604 Lilac Ave
- Lot 12 Shady Elm