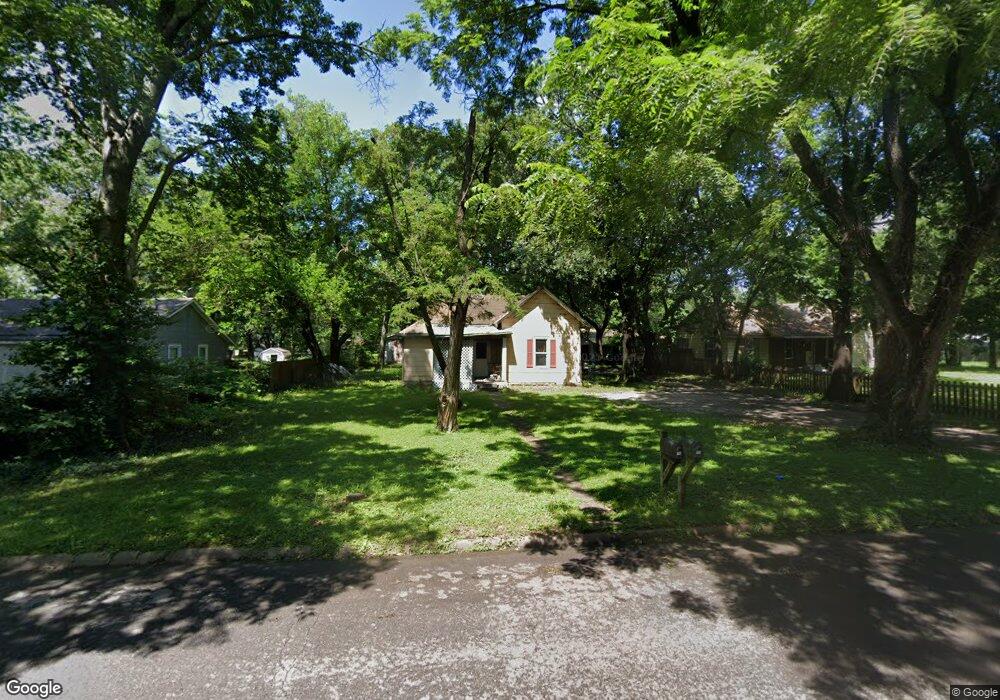
713 Chestnut St Emporia, KS 66801
Estimated Value: $87,000 - $104,670
2
Beds
1
Bath
898
Sq Ft
$104/Sq Ft
Est. Value
About This Home
This home is located at 713 Chestnut St, Emporia, KS 66801 and is currently estimated at $93,418, approximately $104 per square foot. 713 Chestnut St is a home located in Lyon County with nearby schools including Village Elementary School, Emporia Middle School, and Emporia High School.
Ownership History
Date
Name
Owned For
Owner Type
Purchase Details
Closed on
Apr 23, 2025
Sold by
Selby Lyman L Living Trust
Bought by
Guzman Properties Llc
Current Estimated Value
Home Financials for this Owner
Home Financials are based on the most recent Mortgage that was taken out on this home.
Original Mortgage
$94,189
Outstanding Balance
$93,006
Interest Rate
0.67%
Mortgage Type
Construction
Estimated Equity
$412
Purchase Details
Closed on
Dec 1, 1982
Bought by
Selby Lyman L Rev Living Trust & Se
Create a Home Valuation Report for This Property
The Home Valuation Report is an in-depth analysis detailing your home's value as well as a comparison with similar homes in the area
Home Values in the Area
Average Home Value in this Area
Purchase History
| Date | Buyer | Sale Price | Title Company |
|---|---|---|---|
| Guzman Properties Llc | $117,736 | -- | |
| Selby Lyman L Rev Living Trust & Se | $25,500 | -- |
Source: Public Records
Mortgage History
| Date | Status | Borrower | Loan Amount |
|---|---|---|---|
| Open | Guzman Properties Llc | $94,189 | |
| Closed | Guzman Properties Llc | $85,329 |
Source: Public Records
Tax History Compared to Growth
Tax History
| Year | Tax Paid | Tax Assessment Tax Assessment Total Assessment is a certain percentage of the fair market value that is determined by local assessors to be the total taxable value of land and additions on the property. | Land | Improvement |
|---|---|---|---|---|
| 2025 | $1,121 | $8,269 | $2,131 | $6,138 |
| 2024 | $1,121 | $7,521 | $1,929 | $5,592 |
| 2023 | $1,105 | $7,137 | $1,781 | $5,356 |
| 2022 | $895 | $6,045 | $1,454 | $4,591 |
| 2021 | $796 | $5,245 | $1,213 | $4,032 |
| 2020 | $592 | $5,075 | $1,137 | $3,938 |
| 2019 | $592 | $3,818 | $972 | $2,846 |
| 2018 | $564 | $3,637 | $972 | $2,665 |
| 2017 | $554 | $3,565 | $972 | $2,593 |
| 2016 | $421 | $2,772 | $972 | $1,800 |
| 2015 | -- | $3,231 | $959 | $2,272 |
| 2014 | -- | $3,369 | $928 | $2,441 |
Source: Public Records
Map
Nearby Homes