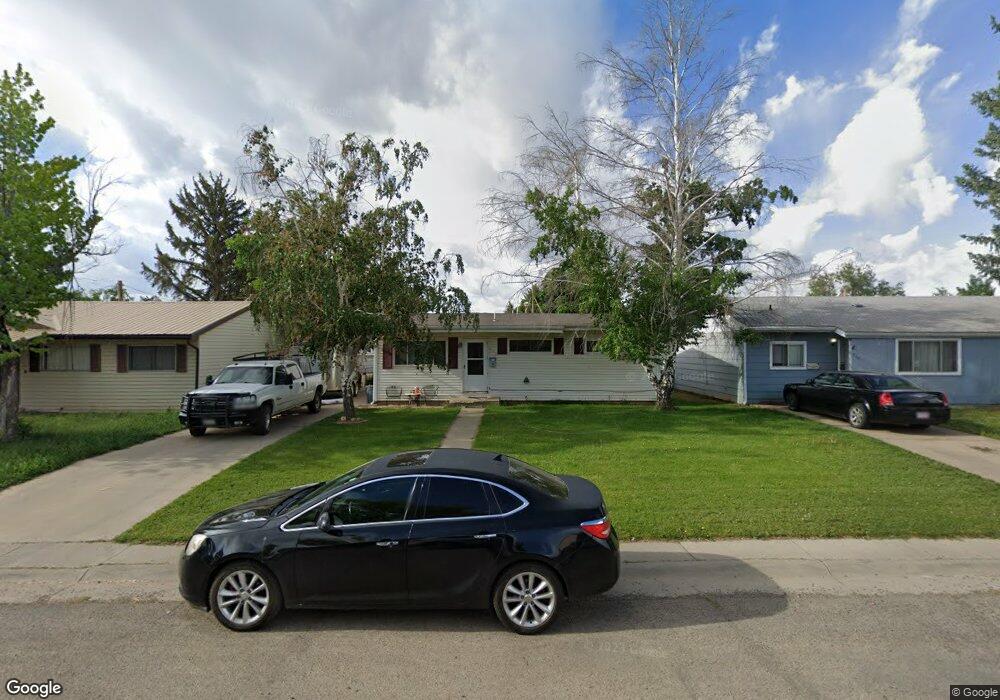
713 E 3rd St Cortez, CO 81321
Estimated Value: $253,466 - $291,000
2
Beds
2
Baths
1,116
Sq Ft
$247/Sq Ft
Est. Value
About This Home
This home is located at 713 E 3rd St, Cortez, CO 81321 and is currently estimated at $275,867, approximately $247 per square foot. 713 E 3rd St is a home with nearby schools including Montezuma-Cortez High School, Children's Kiva Montessori School, and Children's Kiva Montessori Preschool & Kindergarten.
Ownership History
Date
Name
Owned For
Owner Type
Purchase Details
Closed on
Mar 20, 2007
Sold by
Machenberg Family Lp
Bought by
Machenberg Family Llp
Current Estimated Value
Purchase Details
Closed on
Nov 17, 2004
Sold by
Machenberg Stanley E
Bought by
Machenberg Family Limited Partnership
Purchase Details
Closed on
Nov 5, 2004
Sold by
White Paul R
Bought by
Machenberg Stanley E
Purchase Details
Closed on
May 30, 1995
Sold by
Watkins Felton V and Watkins Opal
Bought by
White Paul R
Create a Home Valuation Report for This Property
The Home Valuation Report is an in-depth analysis detailing your home's value as well as a comparison with similar homes in the area
Purchase History
| Date | Buyer | Sale Price | Title Company |
|---|---|---|---|
| Machenberg Family Llp | -- | None Available | |
| Machenberg Family Limited Partnership | -- | -- | |
| Machenberg Stanley E | $90,000 | -- | |
| White Paul R | $66,000 | -- |
Source: Public Records
Tax History
| Year | Tax Paid | Tax Assessment Tax Assessment Total Assessment is a certain percentage of the fair market value that is determined by local assessors to be the total taxable value of land and additions on the property. | Land | Improvement |
|---|---|---|---|---|
| 2024 | $920 | $13,674 | $2,179 | $11,495 |
| 2023 | $703 | $18,051 | $2,876 | $15,175 |
| 2022 | $597 | $12,337 | $1,313 | $11,024 |
| 2021 | $607 | $12,337 | $1,313 | $11,024 |
| 2020 | $506 | $10,670 | $1,445 | $9,225 |
| 2019 | $507 | $10,670 | $1,445 | $9,225 |
| 2018 | $475 | $7,450 | $1,310 | $6,140 |
| 2017 | $472 | $7,450 | $1,310 | $6,140 |
| 2016 | $414 | $7,210 | $1,440 | $5,770 |
| 2015 | $380 | $105,060 | $0 | $0 |
| 2014 | $443 | $7,210 | $0 | $0 |
Source: Public Records
Map
Nearby Homes
Your Personal Tour Guide
Ask me questions while you tour the home.