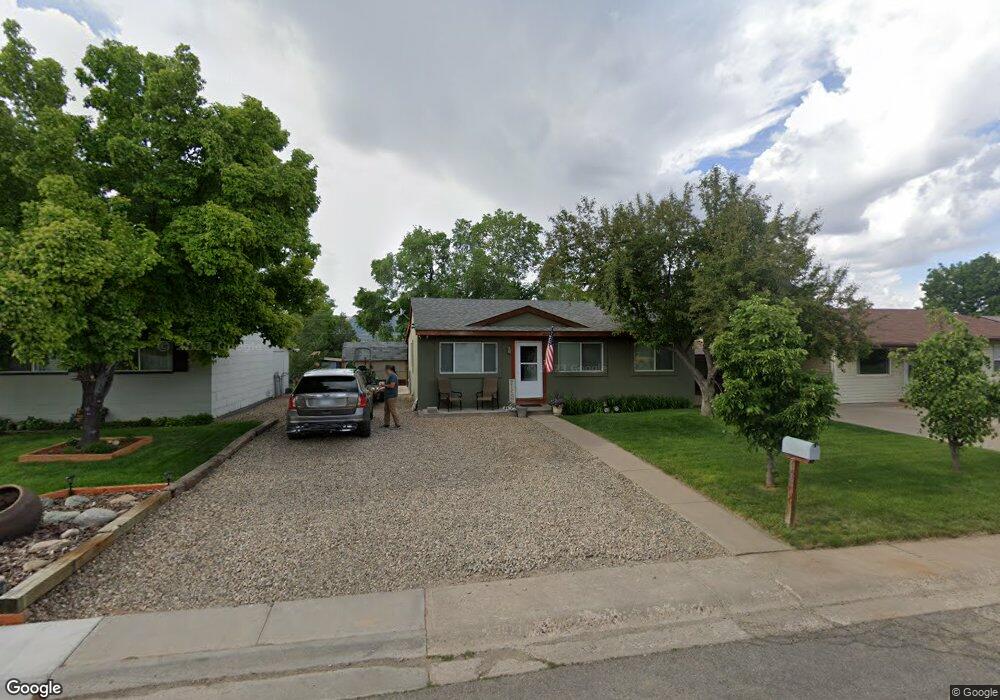
713 E 4th St Cortez, CO 81321
Estimated Value: $214,000 - $268,000
3
Beds
1
Bath
926
Sq Ft
$260/Sq Ft
Est. Value
About This Home
This home is located at 713 E 4th St, Cortez, CO 81321 and is currently estimated at $240,839, approximately $260 per square foot. 713 E 4th St is a home with nearby schools including Montezuma-Cortez High School, Children's Kiva Montessori School, and Children's Kiva Montessori Preschool & Kindergarten.
Ownership History
Date
Name
Owned For
Owner Type
Purchase Details
Closed on
Apr 25, 2002
Sold by
White Christopher M
Bought by
White Christopher M and White Alisha B
Current Estimated Value
Purchase Details
Closed on
Apr 1, 1997
Sold by
Martinez Salvador
Bought by
White Christopher M
Purchase Details
Closed on
Jul 10, 1996
Sold by
Robinson Steve D and Robinson Elle
Bought by
Martinez Salvador
Purchase Details
Closed on
May 12, 1992
Sold by
Ferland Michael C
Bought by
Robinson Steve D and Robinson Ellen H
Create a Home Valuation Report for This Property
The Home Valuation Report is an in-depth analysis detailing your home's value as well as a comparison with similar homes in the area
Purchase History
| Date | Buyer | Sale Price | Title Company |
|---|---|---|---|
| White Christopher M | -- | -- | |
| White Christopher M | $61,500 | -- | |
| Martinez Salvador | $58,000 | -- | |
| Robinson Steve D | $37,000 | -- |
Source: Public Records
Tax History
| Year | Tax Paid | Tax Assessment Tax Assessment Total Assessment is a certain percentage of the fair market value that is determined by local assessors to be the total taxable value of land and additions on the property. | Land | Improvement |
|---|---|---|---|---|
| 2024 | $756 | $10,613 | $2,036 | $8,577 |
| 2023 | $545 | $14,991 | $2,876 | $12,115 |
| 2022 | $491 | $10,138 | $1,313 | $8,825 |
| 2021 | $499 | $10,138 | $1,313 | $8,825 |
| 2020 | $418 | $8,821 | $1,445 | $7,376 |
| 2019 | $419 | $8,821 | $1,445 | $7,376 |
| 2018 | $403 | $6,320 | $1,310 | $5,010 |
| 2017 | $401 | $6,320 | $1,310 | $5,010 |
| 2016 | $353 | $6,140 | $1,440 | $4,700 |
| 2015 | $324 | $89,450 | $0 | $0 |
| 2014 | $377 | $6,140 | $0 | $0 |
Source: Public Records
Map
Nearby Homes
Your Personal Tour Guide
Ask me questions while you tour the home.