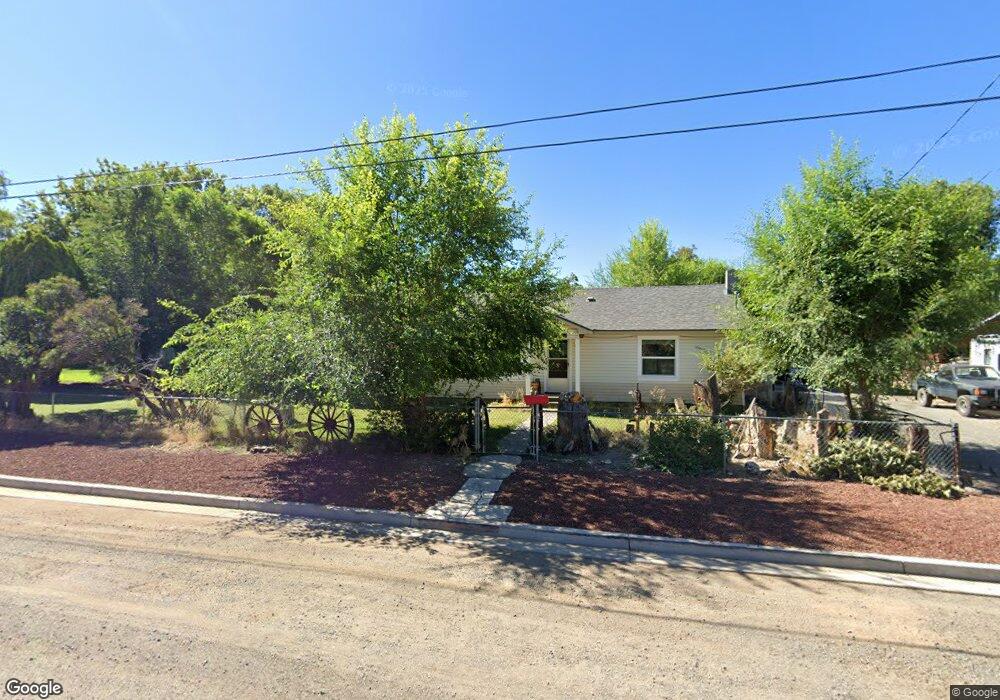
713 E 6th St Alturas, CA 96101
Estimated Value: $172,000 - $199,000
4
Beds
1
Bath
1,475
Sq Ft
$128/Sq Ft
Est. Value
About This Home
This home is located at 713 E 6th St, Alturas, CA 96101 and is currently estimated at $188,741, approximately $127 per square foot. 713 E 6th St is a home located in Modoc County with nearby schools including Modoc High School and New Day Academy.
Ownership History
Date
Name
Owned For
Owner Type
Purchase Details
Closed on
Jul 24, 2025
Sold by
Stanley Royce
Bought by
Stanley Royce Living Trust and Royce
Current Estimated Value
Purchase Details
Closed on
Jul 9, 2021
Sold by
Royce Bruce E and Rouce Stanley
Bought by
Royce Stanley
Purchase Details
Closed on
May 9, 2018
Sold by
Royce Lloyd E
Bought by
Stanley Royce Bruce E and Stanley Royce
Purchase Details
Closed on
Apr 30, 2018
Sold by
Stanley Royce Bruce R and Stanley Royce
Bought by
Stanley Royce Bruce E and Stanley Royce
Purchase Details
Closed on
Jan 29, 2015
Sold by
Royce Lloyd E
Bought by
Royce Lloyd E
Purchase Details
Closed on
Jun 19, 2014
Sold by
Royce Lloyd E
Bought by
Royce Bruce E and Royce Stanley H
Purchase Details
Closed on
May 22, 2014
Sold by
Royce Sylvia B
Bought by
Royce Bruce E and Royce Stanley H
Purchase Details
Closed on
Feb 17, 2010
Sold by
Royce Sylvia M and Royce Sylvia B
Bought by
Royce Lloyd E and Royce Sylvia M
Create a Home Valuation Report for This Property
The Home Valuation Report is an in-depth analysis detailing your home's value as well as a comparison with similar homes in the area
Home Values in the Area
Average Home Value in this Area
Purchase History
| Date | Buyer | Sale Price | Title Company |
|---|---|---|---|
| Stanley Royce Living Trust | -- | None Listed On Document | |
| Royce Stanley | -- | None Available | |
| Stanley Royce Bruce E | -- | None Available | |
| Royce Lloyd E | -- | None Available | |
| Stanley Royce Bruce E | -- | None Available | |
| Royce Lloyd E | -- | None Available | |
| Royce Lloyd E | -- | None Available | |
| Royce Lloyd E | -- | None Available | |
| Royce Bruce E | -- | None Available | |
| Royce Bruce E | -- | None Available | |
| Royce Lloyd E | -- | None Available |
Source: Public Records
Tax History
| Year | Tax Paid | Tax Assessment Tax Assessment Total Assessment is a certain percentage of the fair market value that is determined by local assessors to be the total taxable value of land and additions on the property. | Land | Improvement |
|---|---|---|---|---|
| 2025 | $1,010 | $83,871 | $8,570 | $75,301 |
| 2024 | $1,010 | $82,227 | $8,402 | $73,825 |
| 2023 | $994 | $80,616 | $8,238 | $72,378 |
| 2022 | $978 | $79,036 | $8,077 | $70,959 |
| 2021 | $822 | $56,368 | $5,428 | $50,940 |
| 2020 | $816 | $55,791 | $5,373 | $50,418 |
| 2019 | $805 | $54,698 | $5,268 | $49,430 |
| 2018 | $724 | $53,626 | $5,165 | $48,461 |
| 2017 | $714 | $52,575 | $5,064 | $47,511 |
| 2016 | $703 | $51,545 | $4,965 | $46,580 |
| 2015 | $696 | $50,772 | $4,891 | $45,881 |
| 2014 | $686 | $49,779 | $4,796 | $44,983 |
Source: Public Records
Map
Nearby Homes
Your Personal Tour Guide
Ask me questions while you tour the home.