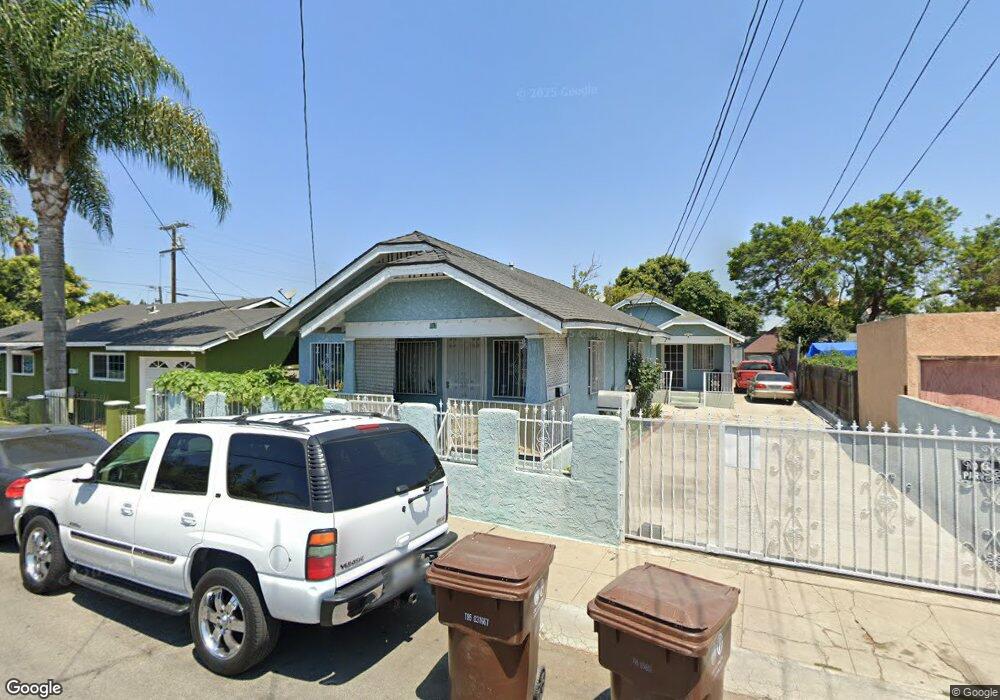
713 E Elm St Compton, CA 90221
Estimated Value: $546,779 - $744,000
4
Beds
2
Baths
1,392
Sq Ft
$464/Sq Ft
Est. Value
About This Home
This home is located at 713 E Elm St, Compton, CA 90221 and is currently estimated at $645,195, approximately $463 per square foot. 713 E Elm St is a home located in Los Angeles County with nearby schools including Mayo Elementary School, Whaley Middle School, and Dominguez High School.
Ownership History
Date
Name
Owned For
Owner Type
Purchase Details
Closed on
Apr 15, 2025
Sold by
Rb Service Inc
Bought by
Byun Revocable Living Trust and Byun
Current Estimated Value
Purchase Details
Closed on
Jan 17, 2020
Sold by
Ponce Jesus Reyes and Reyes Guadalupe
Bought by
Reyes Guadalupe and Reyes Ruben
Purchase Details
Closed on
Jan 4, 2018
Sold by
Reyes Jaime
Bought by
Reyes Jesus and Reyes Guadalupe
Purchase Details
Closed on
Jun 15, 2001
Sold by
Soto Jesus P and Soto Maria G
Bought by
Reyes Jaime and Reyes Jesus
Home Financials for this Owner
Home Financials are based on the most recent Mortgage that was taken out on this home.
Original Mortgage
$159,497
Interest Rate
7.21%
Mortgage Type
FHA
Purchase Details
Closed on
Feb 7, 1995
Sold by
Gomez Jesus A and Gomez Rosa E
Bought by
Soto Jesus P and Soto Maria G
Create a Home Valuation Report for This Property
The Home Valuation Report is an in-depth analysis detailing your home's value as well as a comparison with similar homes in the area
Home Values in the Area
Average Home Value in this Area
Purchase History
| Date | Buyer | Sale Price | Title Company |
|---|---|---|---|
| Byun Revocable Living Trust | -- | None Listed On Document | |
| Reyes Guadalupe | -- | None Available | |
| Reyes Jesus | -- | None Available | |
| Reyes Jaime | $162,000 | First American Title Co | |
| Soto Jesus P | -- | -- |
Source: Public Records
Mortgage History
| Date | Status | Borrower | Loan Amount |
|---|---|---|---|
| Previous Owner | Reyes Jaime | $159,497 |
Source: Public Records
Tax History
| Year | Tax Paid | Tax Assessment Tax Assessment Total Assessment is a certain percentage of the fair market value that is determined by local assessors to be the total taxable value of land and additions on the property. | Land | Improvement |
|---|---|---|---|---|
| 2025 | $5,190 | $239,299 | $112,560 | $126,739 |
| 2024 | $5,190 | $234,607 | $110,353 | $124,254 |
| 2023 | $5,107 | $230,008 | $108,190 | $121,818 |
| 2022 | $4,204 | $225,499 | $106,069 | $119,430 |
| 2021 | $4,239 | $221,079 | $103,990 | $117,089 |
| 2020 | $4,169 | $218,813 | $102,924 | $115,889 |
| 2019 | $4,122 | $214,523 | $100,906 | $113,617 |
| 2018 | $3,953 | $210,318 | $98,928 | $111,390 |
| 2016 | $3,760 | $202,153 | $95,088 | $107,065 |
| 2015 | $3,599 | $199,117 | $93,660 | $105,457 |
| 2014 | $3,541 | $195,218 | $91,826 | $103,392 |
Source: Public Records
Map
Nearby Homes
- 604 N Santa fe Ave
- 411 N Chester Ave
- 706 E Palmer St
- 223 N Chester Ave
- 611 N Burris Ave
- 204 N Spring Ave
- 1000 N Mayo Ave
- 1111 N Spring Ave
- 406 E Rosecrans Ave
- 1503 N Chester Ave
- 1415 N Spring Ave
- 812 N Poinsettia Ave
- 212 S Santa fe Ave
- 702 N Willowbrook Ave
- 212 E Rosecrans Ave
- 1701 N Pearl Ave
- 1111 N Mulberry St
- 110 S Sloan Ave
- 165 Racquet Club Dr
- 124 W Rosecrans Ave
- 704 N Santa fe Ave
- 707 N Chester Ave
- 701 E Elm St
- 709 N Chester Ave
- 715 E Elm St
- 715 N Chester Ave
- 708 N Santa fe Ave Unit 3
- 719 N Chester Ave
- 712 N Santa fe Ave
- 714 E Elm St
- 623 N Chester Ave
- 708 E Elm St
- 801 N Chester Ave
- 628 N Santa fe Ave
- 802 N Santa fe Ave
- 619 N Chester Ave
- 706 N Chester Ave
- 615 N Chester Ave
- 710 N Chester Ave
- 806 N Santa fe Ave
Your Personal Tour Guide
Ask me questions while you tour the home.