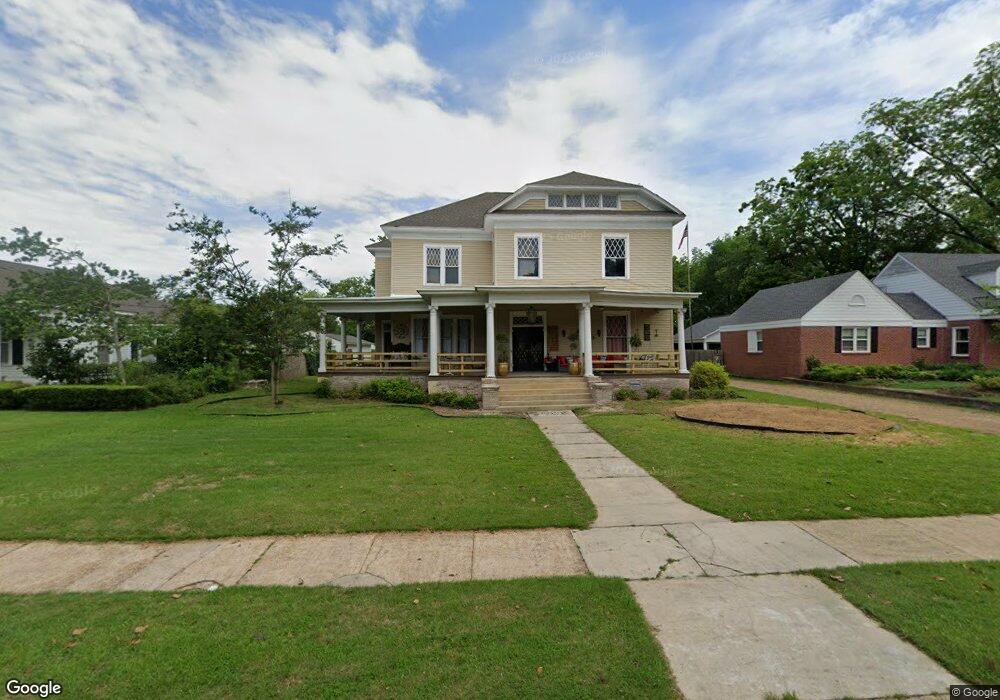
713 E Main St West Point, MS 39773
Estimated Value: $231,000 - $347,000
4
Beds
--
Bath
4,395
Sq Ft
$67/Sq Ft
Est. Value
About This Home
This home is located at 713 E Main St, West Point, MS 39773 and is currently estimated at $294,191, approximately $66 per square foot. 713 E Main St is a home located in Clay County with nearby schools including East Side Elementary School, West Clay Elementary School, and Church Hill Elementary School.
Ownership History
Date
Name
Owned For
Owner Type
Purchase Details
Closed on
Mar 18, 2024
Sold by
Busby Michael K and Busby Melanie G
Bought by
Yeldell Diane
Current Estimated Value
Home Financials for this Owner
Home Financials are based on the most recent Mortgage that was taken out on this home.
Original Mortgage
$258,241
Outstanding Balance
$253,187
Interest Rate
6.63%
Mortgage Type
FHA
Estimated Equity
$41,004
Purchase Details
Closed on
May 1, 2006
Sold by
Weaver Pippen Ester
Bought by
Busby Micheal K and Busby Melanie G
Home Financials for this Owner
Home Financials are based on the most recent Mortgage that was taken out on this home.
Original Mortgage
$206,349
Interest Rate
6.33%
Create a Home Valuation Report for This Property
The Home Valuation Report is an in-depth analysis detailing your home's value as well as a comparison with similar homes in the area
Purchase History
| Date | Buyer | Sale Price | Title Company |
|---|---|---|---|
| Yeldell Diane | -- | None Listed On Document | |
| Busby Micheal K | -- | -- |
Source: Public Records
Mortgage History
| Date | Status | Borrower | Loan Amount |
|---|---|---|---|
| Open | Yeldell Diane | $258,241 | |
| Previous Owner | Busby Micheal K | $206,349 |
Source: Public Records
Tax History
| Year | Tax Paid | Tax Assessment Tax Assessment Total Assessment is a certain percentage of the fair market value that is determined by local assessors to be the total taxable value of land and additions on the property. | Land | Improvement |
|---|---|---|---|---|
| 2025 | $1,146 | $23,900 | $3,297 | $20,603 |
| 2024 | $1,146 | $23,900 | $3,297 | $20,603 |
| 2023 | $2,480 | $18,573 | $3,297 | $15,276 |
| 2022 | $886 | $18,573 | $3,297 | $15,276 |
| 2021 | $873 | $18,573 | $3,297 | $15,276 |
| 2020 | $878 | $18,573 | $3,297 | $15,276 |
| 2019 | $800 | $18,434 | $3,297 | $15,137 |
| 2018 | $770 | $18,434 | $3,297 | $15,137 |
| 2017 | $762 | $18,434 | $3,297 | $15,137 |
| 2016 | $755 | $18,434 | $3,297 | $15,137 |
| 2015 | $705 | $17,028 | $3,297 | $13,731 |
| 2014 | $601 | $17,028 | $3,297 | $13,731 |
| 2013 | $601 | $17,028 | $3,297 | $13,731 |
Source: Public Records
Map
Nearby Homes
- 26788 E Main St
- 26852 E Main St
- 123 Cottrell St
- 26596 E Main St
- 27045 E Main St
- 551 E Westbrook St
- 184 Tournament St
- 238 Calhoun St
- 530 E Morrow St
- 33 Court
- 228 S Division St
- 229 S Division St
- 761 E Morrow St
- 341 Mccord St
- 913 E Westbrook St
- 228 Mccord St
- 13 Cul de Sac St
- 159 Washington St
- 0 Mississippi 50
- 74 Tom Bayne St
Your Personal Tour Guide
Ask me questions while you tour the home.