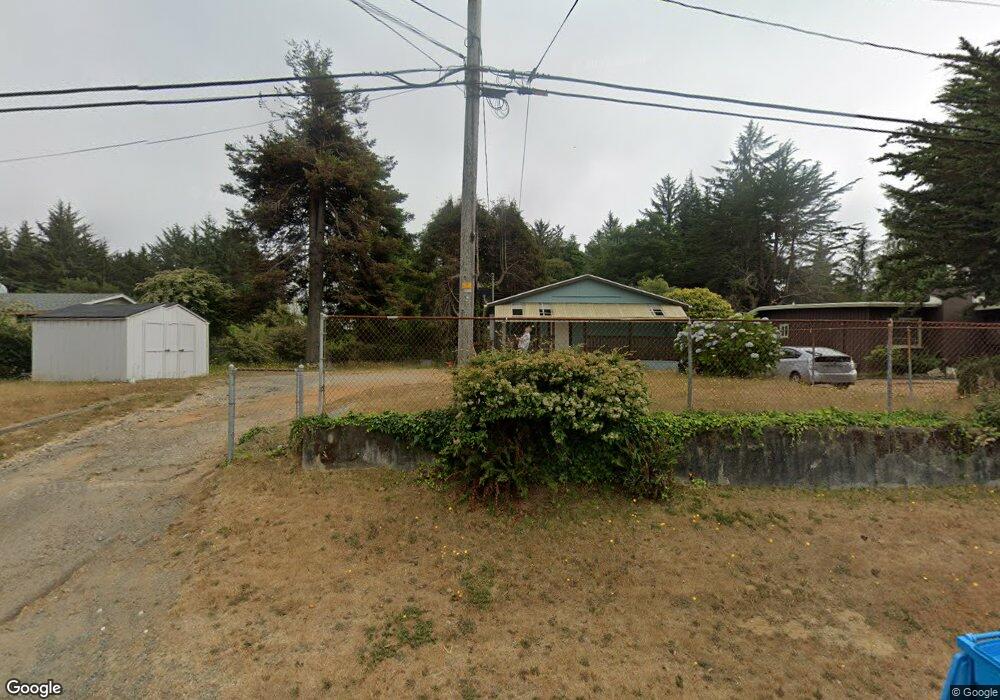
713 E Washington Blvd Crescent City, CA 95531
Estimated Value: $149,000 - $201,000
2
Beds
1
Bath
636
Sq Ft
$265/Sq Ft
Est. Value
About This Home
This home is located at 713 E Washington Blvd, Crescent City, CA 95531 and is currently estimated at $168,421, approximately $264 per square foot. 713 E Washington Blvd is a home located in Del Norte County with nearby schools including Bess Maxwell Elementary School, Crescent Elk Middle School, and Del Norte High School.
Ownership History
Date
Name
Owned For
Owner Type
Purchase Details
Closed on
Jun 2, 2021
Sold by
William Wilson Leonard
Bought by
Wilson Judith E
Current Estimated Value
Home Financials for this Owner
Home Financials are based on the most recent Mortgage that was taken out on this home.
Original Mortgage
$75,000
Outstanding Balance
$67,903
Interest Rate
2.9%
Mortgage Type
New Conventional
Estimated Equity
$100,518
Purchase Details
Closed on
May 27, 2021
Sold by
Wilson Judith E
Bought by
Jacobs Lawrence M
Home Financials for this Owner
Home Financials are based on the most recent Mortgage that was taken out on this home.
Original Mortgage
$75,000
Outstanding Balance
$67,903
Interest Rate
2.9%
Mortgage Type
New Conventional
Estimated Equity
$100,518
Purchase Details
Closed on
Oct 25, 2016
Sold by
Wilson Leonard W and Wilson Judith E
Bought by
Wilson Leonard W and Wilson Judith E
Purchase Details
Closed on
Mar 29, 2007
Sold by
Wilson Effie and Wilson Effie H
Bought by
Wilson Leonard W
Create a Home Valuation Report for This Property
The Home Valuation Report is an in-depth analysis detailing your home's value as well as a comparison with similar homes in the area
Home Values in the Area
Average Home Value in this Area
Purchase History
| Date | Buyer | Sale Price | Title Company |
|---|---|---|---|
| Wilson Judith E | -- | -- | |
| Jacobs Lawrence M | $100,000 | First American Title Company | |
| Lawrence M Jacobs 2020 Trust | $100,000 | First American Title | |
| Wilson Judith E | -- | -- | |
| Wilson Leonard W | -- | None Available | |
| Wilson Leonard W | -- | None Available |
Source: Public Records
Mortgage History
| Date | Status | Borrower | Loan Amount |
|---|---|---|---|
| Open | Wilson Judith E | $75,000 | |
| Closed | Wilson Judith E | $75,000 |
Source: Public Records
Tax History Compared to Growth
Tax History
| Year | Tax Paid | Tax Assessment Tax Assessment Total Assessment is a certain percentage of the fair market value that is determined by local assessors to be the total taxable value of land and additions on the property. | Land | Improvement |
|---|---|---|---|---|
| 2025 | $1,342 | $108,241 | $64,945 | $43,296 |
| 2024 | $1,342 | $106,120 | $63,672 | $42,448 |
| 2023 | $1,227 | $104,040 | $62,424 | $41,616 |
| 2022 | $1,204 | $19,308 | $8,227 | $11,081 |
| 2021 | $341 | $18,930 | $8,066 | $10,864 |
| 2020 | $284 | $18,737 | $7,984 | $10,753 |
| 2019 | $281 | $18,371 | $7,828 | $10,543 |
| 2018 | $276 | $18,012 | $7,675 | $10,337 |
| 2017 | $431 | $17,660 | $7,525 | $10,135 |
| 2016 | $422 | $17,315 | $7,378 | $9,937 |
| 2015 | $432 | $17,056 | $7,268 | $9,788 |
| 2014 | $418 | $16,723 | $7,126 | $9,597 |
Source: Public Records
Map
Nearby Homes
- 0000 E Washington Blvd
- 525 Leif Cir
- 160 Leif Cir
- 650 E Washington Blvd
- 650 E Washington Blvd Unit Crescent Senior Mobi
- 1329 Burtschell Place
- 435 Leif Cir Unit Washington
- 1661 Northcrest Dr Unit Space 96
- 120 Tide St
- 365 Leif Cir
- 0 E Adams Ave
- 1210 Douglas St
- 1725 Northcrest Dr
- 1718 Northcrest Dr
- 1102 Burtschell St
- 1811 Northcrest Dr
- 125 W Washington Blvd
- 120 W Coolidge Ave
- 145 Mason Ct
- 1775 Northcrest Dr
- 729 E Washington Blvd Unit ACROSS FROM SUTTER C
- 729 E Washington Blvd
- 701 E Washington Blvd
- 1482 Burtschell St
- 1472 Burtschell St
- 741 E Washington Blvd
- 0 E Washington Blvd
- 625 E Washington Blvd
- 1452 Burtschell St
- 690 E Washington Blvd
- 1491 Harrold St
- 1440 Douglas St
- 1441 Harrold St Unit 1447 HARROLD STREET
- 1441 Harrold St Unit 47
- 1405 Douglas St
- 115 Leif Cir
- 650 E Washinton
- 1425 Harrold St
- 1421 Harrold St
- 650 W Washington Blvd Sp 27