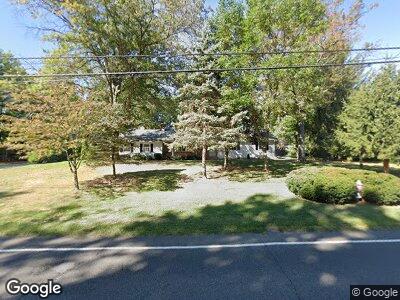
713 Eayrestown Rd Lumberton, NJ 08048
Bobbys Run NeighborhoodEstimated Value: $356,000 - $527,000
--
Bed
--
Bath
1,612
Sq Ft
$259/Sq Ft
Est. Value
About This Home
This home is located at 713 Eayrestown Rd, Lumberton, NJ 08048 and is currently estimated at $417,511, approximately $259 per square foot. 713 Eayrestown Rd is a home located in Burlington County with nearby schools including Ashbrook Elementary School, Bobby’s Run School, and Lumberton Middle School.
Ownership History
Date
Name
Owned For
Owner Type
Purchase Details
Closed on
Aug 23, 2002
Sold by
Klumpp Jeffrey R and Klumpp Maureen
Bought by
Klumpp Jeffrey R and Klumpp Maureen
Current Estimated Value
Home Financials for this Owner
Home Financials are based on the most recent Mortgage that was taken out on this home.
Original Mortgage
$153,417
Interest Rate
6.36%
Mortgage Type
FHA
Purchase Details
Closed on
Sep 30, 1999
Sold by
Kutchko Doris P
Bought by
Klumpp Jeffrey and Klumpp Maureen
Home Financials for this Owner
Home Financials are based on the most recent Mortgage that was taken out on this home.
Original Mortgage
$155,317
Interest Rate
7.8%
Mortgage Type
FHA
Create a Home Valuation Report for This Property
The Home Valuation Report is an in-depth analysis detailing your home's value as well as a comparison with similar homes in the area
Home Values in the Area
Average Home Value in this Area
Purchase History
| Date | Buyer | Sale Price | Title Company |
|---|---|---|---|
| Klumpp Jeffrey | $159,900 | -- |
Source: Public Records
Mortgage History
| Date | Status | Borrower | Loan Amount |
|---|---|---|---|
| Open | Klumpp Jeffrey R | $202,400 | |
| Closed | Klumpp Jeffrey R | $232,792 | |
| Closed | Klumpp Jeffrey R | $254,375 | |
| Closed | Klumpp Jeffrey | $252,000 | |
| Closed | Klumpp Jeffrey R | $10,000 | |
| Closed | Klumpp Jeffrey R | $200,000 | |
| Closed | Klumpp Jeffrey | $153,112 | |
| Closed | Klumpp Jeffrey R | $153,417 | |
| Previous Owner | Klumpp Jeffrey | $153,620 | |
| Previous Owner | Klumpp Jeffrey | $153,650 | |
| Previous Owner | Klumpp Jeffrey | $155,317 |
Source: Public Records
Tax History Compared to Growth
Tax History
| Year | Tax Paid | Tax Assessment Tax Assessment Total Assessment is a certain percentage of the fair market value that is determined by local assessors to be the total taxable value of land and additions on the property. | Land | Improvement |
|---|---|---|---|---|
| 2024 | $7,649 | $305,600 | $100,000 | $205,600 |
| 2023 | $7,649 | $305,600 | $100,000 | $205,600 |
| 2022 | $7,472 | $305,600 | $100,000 | $205,600 |
| 2021 | $7,451 | $305,600 | $100,000 | $205,600 |
| 2020 | $7,386 | $305,600 | $100,000 | $205,600 |
| 2019 | $7,304 | $305,600 | $100,000 | $205,600 |
| 2018 | $7,194 | $305,600 | $100,000 | $205,600 |
| 2017 | $7,059 | $305,600 | $100,000 | $205,600 |
| 2016 | $6,907 | $305,600 | $100,000 | $205,600 |
| 2015 | $6,855 | $305,600 | $100,000 | $205,600 |
| 2014 | $6,595 | $305,600 | $100,000 | $205,600 |
Source: Public Records
Map
Nearby Homes
- 15 Ginger Dr
- 14 Cinnamon Dr
- 6 Basil Dr
- 11 Abington Way
- 687 Eayrestown Rd
- 29 Sycamore Ct
- 16 Windermere Dr
- 39 Tynemouth Dr
- 6 Nottingham Ct
- 29 Tynemouth Dr
- 409 Maple Grove Blvd
- 25 Westminster Dr
- 619 Walden Way
- 11 Peppermint Dr
- 33 Sassafras Dr Unit 33
- 5 Spencer Ct
- 3 Estate Rd
- 15 Glenwood Rd
- 131 Harrogate Dr
- 11 Waterford Dr