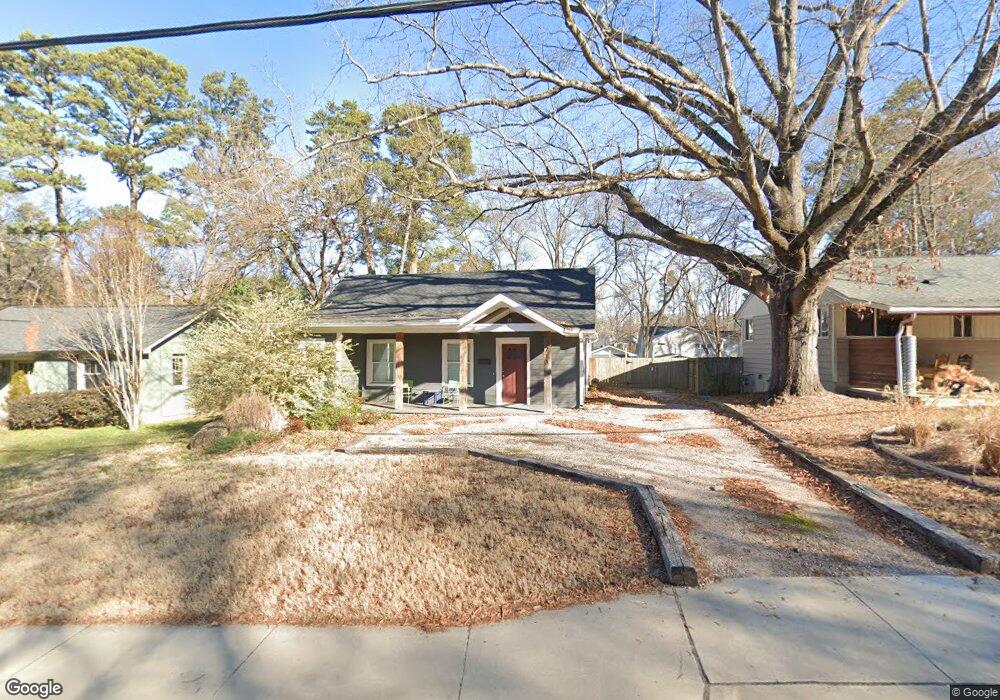
713 Glascock St Raleigh, NC 27604
Belvedere Park NeighborhoodEstimated Value: $537,000 - $932,000
2
Beds
1
Bath
1,297
Sq Ft
$592/Sq Ft
Est. Value
About This Home
This home is located at 713 Glascock St, Raleigh, NC 27604 and is currently estimated at $767,672, approximately $591 per square foot. 713 Glascock St is a home located in Wake County with nearby schools including Conn Elementary, Ligon Magnet Middle School, and Enloe High.
Ownership History
Date
Name
Owned For
Owner Type
Purchase Details
Closed on
Sep 22, 2017
Sold by
Gentilcore Nicholas and Watkins Jennifer
Bought by
Gentilcore Nicholas
Current Estimated Value
Home Financials for this Owner
Home Financials are based on the most recent Mortgage that was taken out on this home.
Original Mortgage
$417,000
Outstanding Balance
$348,131
Interest Rate
3.89%
Mortgage Type
New Conventional
Estimated Equity
$419,541
Purchase Details
Closed on
Nov 4, 2015
Sold by
Dulberg Martin S
Bought by
Gentilcore Nicholas and Watkins Jennifer
Home Financials for this Owner
Home Financials are based on the most recent Mortgage that was taken out on this home.
Original Mortgage
$361,920
Interest Rate
3.89%
Mortgage Type
New Conventional
Purchase Details
Closed on
Jun 5, 2014
Sold by
White Nancy P and Hoselton Jennifer L
Bought by
Dulberg Martin S
Purchase Details
Closed on
May 8, 2014
Sold by
Kip Dell Homes Inc
Bought by
White Nancy P and Hoselton Jennifer L
Create a Home Valuation Report for This Property
The Home Valuation Report is an in-depth analysis detailing your home's value as well as a comparison with similar homes in the area
Home Values in the Area
Average Home Value in this Area
Purchase History
| Date | Buyer | Sale Price | Title Company |
|---|---|---|---|
| Gentilcore Nicholas | -- | None Available | |
| Gentilcore Nicholas | $452,500 | Attorney | |
| Dulberg Martin S | $169,000 | None Available | |
| White Nancy P | $159,000 | None Available |
Source: Public Records
Mortgage History
| Date | Status | Borrower | Loan Amount |
|---|---|---|---|
| Open | Gentilcore Nicholas | $417,000 | |
| Closed | Gentilcore Nicholas | $361,920 | |
| Closed | Gentilcore Nicholas | $67,860 |
Source: Public Records
Tax History Compared to Growth
Tax History
| Year | Tax Paid | Tax Assessment Tax Assessment Total Assessment is a certain percentage of the fair market value that is determined by local assessors to be the total taxable value of land and additions on the property. | Land | Improvement |
|---|---|---|---|---|
| 2025 | $5,451 | $622,696 | $300,000 | $322,696 |
| 2024 | $5,428 | $622,696 | $300,000 | $322,696 |
| 2023 | $6,296 | $575,787 | $225,000 | $350,787 |
| 2022 | $5,850 | $575,787 | $225,000 | $350,787 |
| 2021 | $5,622 | $575,787 | $225,000 | $350,787 |
| 2020 | $5,520 | $575,787 | $225,000 | $350,787 |
| 2019 | $5,126 | $440,589 | $120,000 | $320,589 |
| 2018 | $4,834 | $440,589 | $120,000 | $320,589 |
| 2017 | $4,603 | $440,589 | $120,000 | $320,589 |
| 2016 | $4,509 | $171,679 | $120,000 | $51,679 |
| 2015 | $1,736 | $165,734 | $103,500 | $62,234 |
| 2014 | $1,647 | $165,734 | $103,500 | $62,234 |
Source: Public Records
Map
Nearby Homes
- 700 Glascock St
- 622 Glascock St
- 625 Glascock St
- 604 Edmund St
- 1212 Brookside Dr
- 512 Edgecreek Ct
- 516 Edgecreek Ct
- 515 Edgecreek Ct
- 517 Edgecreek Ct
- 513 Edgecreek Ct
- 1213 Brookside Dr
- 1215 Brookside Dr
- 713 N State St
- 709 N State St
- 406 Columbia Dr
- 712 Van Buren Rd
- 717 Penn Rd
- 1409 Lions Way
- 1809 Bennett St
- 1813 Bennett St
- 715 Glascock St
- 711 Glascock St
- 717 Glascock St
- 709 Glascock St
- 712 Edmund St
- 710 Edmund St
- 714 Edmund St
- 707 Glascock St
- 708 Edmund St
- 718 Edmund St
- 702 Glascock St
- 704 Glascock St
- 706 Edmund St
- 706 Glascock St
- 705 Glascock St
- 721 Glascock St
- 708 Glascock St
- 1102 Grace St
- 626 Glascock St
- 704 Edmund St