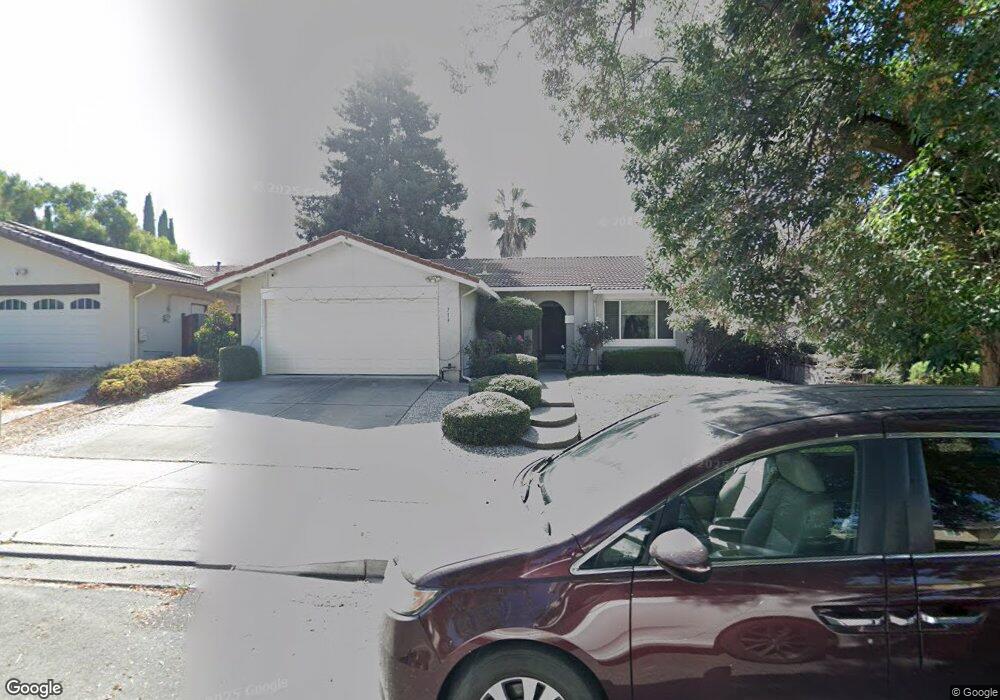
713 Iroquois Way Fremont, CA 94539
Warm Springs NeighborhoodEstimated Value: $1,850,850 - $2,094,000
3
Beds
2
Baths
1,542
Sq Ft
$1,250/Sq Ft
Est. Value
About This Home
This home is located at 713 Iroquois Way, Fremont, CA 94539 and is currently estimated at $1,927,213, approximately $1,249 per square foot. 713 Iroquois Way is a home located in Alameda County with nearby schools including James Leitch Elementary School, Warm Springs Elementary School, and John M. Horner Junior High School.
Ownership History
Date
Name
Owned For
Owner Type
Purchase Details
Closed on
Jan 7, 2013
Sold by
Bayley Mylinh D and Duong Mylinh
Bought by
Ponakanti Praveen K and Ponakanti Kalpana
Current Estimated Value
Home Financials for this Owner
Home Financials are based on the most recent Mortgage that was taken out on this home.
Original Mortgage
$555,000
Outstanding Balance
$367,391
Interest Rate
2.37%
Mortgage Type
New Conventional
Estimated Equity
$1,559,822
Purchase Details
Closed on
May 26, 2007
Sold by
Duong Mylinh and Duong Francis
Bought by
Duong Mylinh
Purchase Details
Closed on
Apr 30, 2003
Sold by
Tam Raymond On and Tam Katherine Ka Man
Bought by
Duong Mylinh and Duong Francis
Home Financials for this Owner
Home Financials are based on the most recent Mortgage that was taken out on this home.
Original Mortgage
$320,000
Interest Rate
5.75%
Mortgage Type
Purchase Money Mortgage
Purchase Details
Closed on
Oct 14, 1993
Sold by
Tam Raymond and Tam Ka Man
Bought by
Tam Raymond On and Tam Ka Man
Home Financials for this Owner
Home Financials are based on the most recent Mortgage that was taken out on this home.
Original Mortgage
$141,000
Interest Rate
6.81%
Create a Home Valuation Report for This Property
The Home Valuation Report is an in-depth analysis detailing your home's value as well as a comparison with similar homes in the area
Home Values in the Area
Average Home Value in this Area
Purchase History
| Date | Buyer | Sale Price | Title Company |
|---|---|---|---|
| Ponakanti Praveen K | $759,000 | Chicago Title Company | |
| Duong Mylinh | -- | None Available | |
| Duong Mylinh | $493,000 | American Title Company | |
| Tam Raymond On | -- | -- |
Source: Public Records
Mortgage History
| Date | Status | Borrower | Loan Amount |
|---|---|---|---|
| Open | Ponakanti Praveen K | $555,000 | |
| Previous Owner | Duong Mylinh | $320,000 | |
| Previous Owner | Tam Raymond On | $141,000 |
Source: Public Records
Tax History Compared to Growth
Tax History
| Year | Tax Paid | Tax Assessment Tax Assessment Total Assessment is a certain percentage of the fair market value that is determined by local assessors to be the total taxable value of land and additions on the property. | Land | Improvement |
|---|---|---|---|---|
| 2025 | $11,124 | $927,371 | $280,262 | $654,109 |
| 2024 | $11,124 | $909,052 | $274,767 | $641,285 |
| 2023 | $10,828 | $891,092 | $269,380 | $628,712 |
| 2022 | $10,690 | $873,488 | $264,100 | $616,388 |
| 2021 | $10,427 | $856,225 | $258,922 | $604,303 |
| 2020 | $10,466 | $854,377 | $256,268 | $598,109 |
| 2019 | $10,346 | $837,631 | $251,245 | $586,386 |
| 2018 | $10,144 | $821,211 | $246,320 | $574,891 |
| 2017 | $9,889 | $805,109 | $241,490 | $563,619 |
| 2016 | $9,723 | $789,326 | $236,756 | $552,570 |
| 2015 | $9,595 | $777,473 | $233,201 | $544,272 |
| 2014 | $9,431 | $762,244 | $228,633 | $533,611 |
Source: Public Records
Map
Nearby Homes
- 47131 Yucatan Dr
- 47236 Cavanaugh Common
- 281 Hackamore Common
- 136 Hackamore Ln Unit 18
- 524 E Warren Ave
- 114 Hackamore Ln Unit 14
- 46985 Ocotillo Ct
- 47768 Wabana St
- 46869 Fernald Common Unit 38
- 47252 Mission Falls Ct
- 47222 Mission Falls Ct
- 642 Mcduff Ave
- 46925 Aloe Ct
- 472 Mayten Way
- 130 Kootenai Dr
- 296 Kansas Way
- 270 Tuolumne Dr
- 1485 Deschutes Place
- 1748 Kilowatt Way Unit 301
- 2250 Kilowatt Way Unit 214
- 733 Iroquois Way
- 703 Iroquois Way
- 745 Covina Way
- 757 Covina Way
- 753 Iroquois Way
- 691 Iroquois Way
- 769 Covina Way
- 734 Iroquois Way
- 714 Iroquois Way
- 773 Iroquois Way
- 671 Iroquois Way
- 721 Covina Way
- 754 Iroquois Way
- 704 Iroquois Way
- 781 Covina Way
- 774 Iroquois Way
- 682 Iroquois Way
- 793 Iroquois Way
- 793 Covina Way
- 794 Iroquois Way