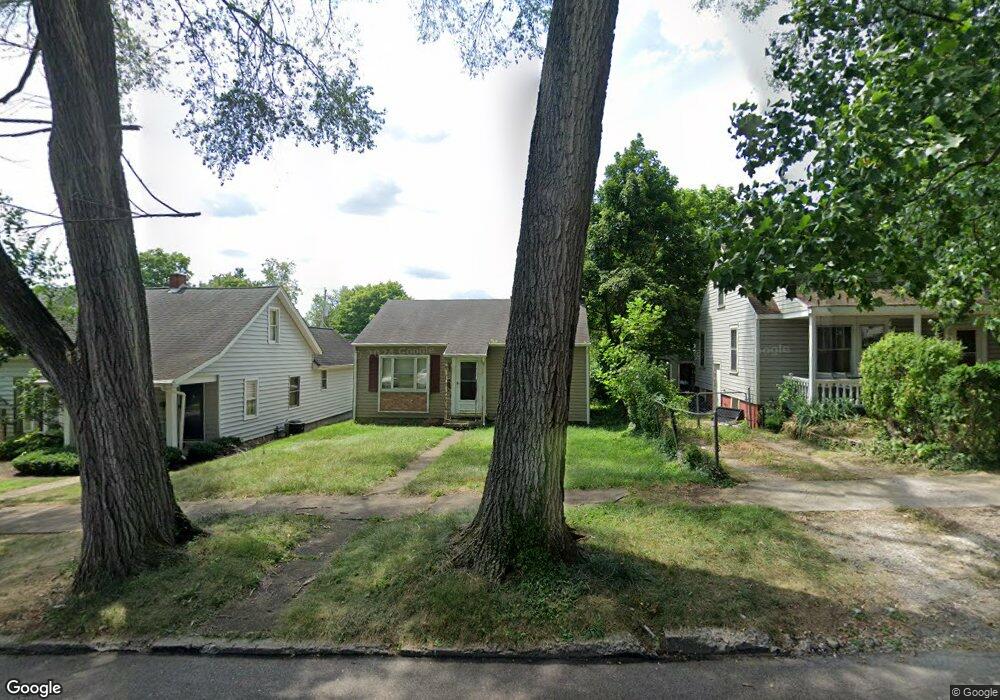
713 Medill Ave Lancaster, OH 43130
Estimated Value: $160,398 - $194,000
2
Beds
1
Bath
672
Sq Ft
$270/Sq Ft
Est. Value
About This Home
This home is located at 713 Medill Ave, Lancaster, OH 43130 and is currently estimated at $181,600, approximately $270 per square foot. 713 Medill Ave is a home located in Fairfield County with nearby schools including Medill Elementary School, Thomas Ewing Junior High School, and Lancaster High School.
Ownership History
Date
Name
Owned For
Owner Type
Purchase Details
Closed on
Jul 20, 2001
Sold by
Magill Stephen E
Bought by
Magill Stephen E Elizabeth A
Current Estimated Value
Home Financials for this Owner
Home Financials are based on the most recent Mortgage that was taken out on this home.
Original Mortgage
$68,850
Outstanding Balance
$26,687
Interest Rate
7.22%
Mortgage Type
New Conventional
Estimated Equity
$154,913
Purchase Details
Closed on
Sep 5, 1995
Sold by
Barker Rita E
Bought by
Luallen Stephen E Magill and Luallen Annette E
Home Financials for this Owner
Home Financials are based on the most recent Mortgage that was taken out on this home.
Original Mortgage
$55,800
Interest Rate
7.55%
Mortgage Type
New Conventional
Purchase Details
Closed on
Jun 23, 1992
Sold by
Barker Rita
Bought by
Barker Ii Charles W
Purchase Details
Closed on
Dec 1, 1988
Create a Home Valuation Report for This Property
The Home Valuation Report is an in-depth analysis detailing your home's value as well as a comparison with similar homes in the area
Home Values in the Area
Average Home Value in this Area
Purchase History
| Date | Buyer | Sale Price | Title Company |
|---|---|---|---|
| Magill Stephen E Elizabeth A | $72,350 | -- | |
| Luallen Stephen E Magill | $58,750 | -- | |
| Barker Ii Charles W | -- | -- | |
| -- | $22,800 | -- |
Source: Public Records
Mortgage History
| Date | Status | Borrower | Loan Amount |
|---|---|---|---|
| Open | Magill Stephen E Elizabeth A | $68,850 | |
| Previous Owner | Luallen Stephen E Magill | $55,800 |
Source: Public Records
Tax History Compared to Growth
Tax History
| Year | Tax Paid | Tax Assessment Tax Assessment Total Assessment is a certain percentage of the fair market value that is determined by local assessors to be the total taxable value of land and additions on the property. | Land | Improvement |
|---|---|---|---|---|
| 2024 | $3,485 | $38,760 | $10,000 | $28,760 |
| 2023 | $1,440 | $38,760 | $10,000 | $28,760 |
| 2022 | $1,449 | $38,760 | $10,000 | $28,760 |
| 2021 | $1,154 | $28,930 | $8,380 | $20,550 |
| 2020 | $1,107 | $28,930 | $8,380 | $20,550 |
| 2019 | $1,053 | $28,930 | $8,380 | $20,550 |
| 2018 | $874 | $23,070 | $8,380 | $14,690 |
| 2017 | $874 | $22,780 | $8,090 | $14,690 |
| 2016 | $852 | $22,780 | $8,090 | $14,690 |
| 2015 | $852 | $22,100 | $8,090 | $14,010 |
| 2014 | $812 | $22,100 | $8,090 | $14,010 |
| 2013 | $812 | $22,100 | $8,090 | $14,010 |
Source: Public Records
Map
Nearby Homes
- 608 Sheridan Dr
- 1150 E Fair Ave
- 831 Franklin Ave
- 1159 E Fair Ave
- 700 E Allen St
- 1275 Wetsell Ave
- 1413 E Mulberry St
- 726 King St
- 716 N Mount Pleasant Ave
- 1129 Stone Run
- 234 S Ewing St
- 521 E Allen St
- 1106 E Walnut St
- 124 Wyandotte St
- 600 N Maple St
- 1020 Sycamore Dr
- 1560 E Main St
- 534 Overlook Dr NE
- 1066 Lanreco Blvd
- 134 Kanawha Rd
- 719 Medill Ave
- 709 Medill Ave
- 705 Medill Ave
- 723 Medill Ave
- 701 Medill Ave
- 727 Medill Ave
- 708 Harding Ave
- 706 Harding Ave
- 710 Harding Ave
- 704 Harding Ave
- 712 Harding Ave
- 731 Medill Ave
- 712 Medill Ave
- 718 Medill Ave
- 710 Medill Ave
- 700 Harding Ave
- 714 Harding Ave
- 704 Medill Ave
- 722 Medill Ave
- 737 Medill Ave