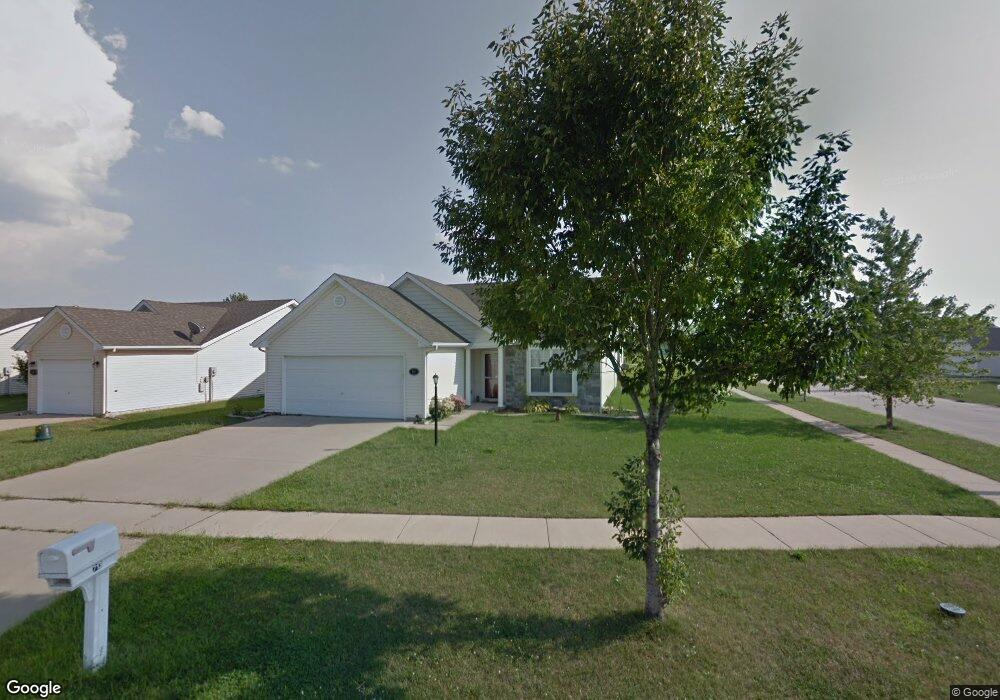
713 Newton Dr Champaign, IL 61822
Estimated Value: $231,000 - $246,000
--
Bed
--
Bath
--
Sq Ft
7,405
Sq Ft Lot
About This Home
This home is located at 713 Newton Dr, Champaign, IL 61822 and is currently estimated at $241,986. 713 Newton Dr is a home located in Champaign County with nearby schools including Central High School, Judah Christian School, and The High School of Saint Thomas More.
Ownership History
Date
Name
Owned For
Owner Type
Purchase Details
Closed on
Nov 23, 2022
Sold by
Gabbard William T
Bought by
Gensler Breanna and Rennick Richard L
Current Estimated Value
Purchase Details
Closed on
Oct 2, 2007
Sold by
Nee Brett M and Hartman Christa R
Bought by
Gabbard William T
Home Financials for this Owner
Home Financials are based on the most recent Mortgage that was taken out on this home.
Original Mortgage
$145,000
Outstanding Balance
$91,893
Interest Rate
6.5%
Mortgage Type
Purchase Money Mortgage
Estimated Equity
$150,093
Purchase Details
Closed on
May 10, 2005
Sold by
Atkins Clinton C
Bought by
Nee Brett and Hartman Christa
Home Financials for this Owner
Home Financials are based on the most recent Mortgage that was taken out on this home.
Original Mortgage
$111,796
Interest Rate
5.5%
Mortgage Type
Fannie Mae Freddie Mac
Create a Home Valuation Report for This Property
The Home Valuation Report is an in-depth analysis detailing your home's value as well as a comparison with similar homes in the area
Home Values in the Area
Average Home Value in this Area
Purchase History
| Date | Buyer | Sale Price | Title Company |
|---|---|---|---|
| Gensler Breanna | -- | Accommodation/Courtesy Recordi | |
| Gabbard William T | $145,000 | None Available | |
| Nee Brett | $140,000 | -- |
Source: Public Records
Mortgage History
| Date | Status | Borrower | Loan Amount |
|---|---|---|---|
| Open | Gabbard William T | $145,000 | |
| Previous Owner | Nee Brett | $111,796 | |
| Closed | Nee Brett | $13,974 |
Source: Public Records
Tax History Compared to Growth
Tax History
| Year | Tax Paid | Tax Assessment Tax Assessment Total Assessment is a certain percentage of the fair market value that is determined by local assessors to be the total taxable value of land and additions on the property. | Land | Improvement |
|---|---|---|---|---|
| 2024 | $4,545 | $61,930 | $15,190 | $46,740 |
| 2023 | $4,545 | $56,400 | $13,830 | $42,570 |
| 2022 | $4,233 | $52,030 | $12,760 | $39,270 |
| 2021 | $4,120 | $51,010 | $12,510 | $38,500 |
| 2020 | $3,991 | $49,530 | $12,150 | $37,380 |
| 2019 | $3,852 | $48,510 | $11,900 | $36,610 |
| 2018 | $3,756 | $47,740 | $11,710 | $36,030 |
| 2017 | $3,683 | $46,760 | $11,470 | $35,290 |
| 2016 | $3,291 | $45,790 | $11,230 | $34,560 |
| 2015 | $3,307 | $44,980 | $11,030 | $33,950 |
| 2014 | $3,279 | $44,980 | $11,030 | $33,950 |
| 2013 | $3,250 | $44,980 | $11,030 | $33,950 |
Source: Public Records
Map
Nearby Homes