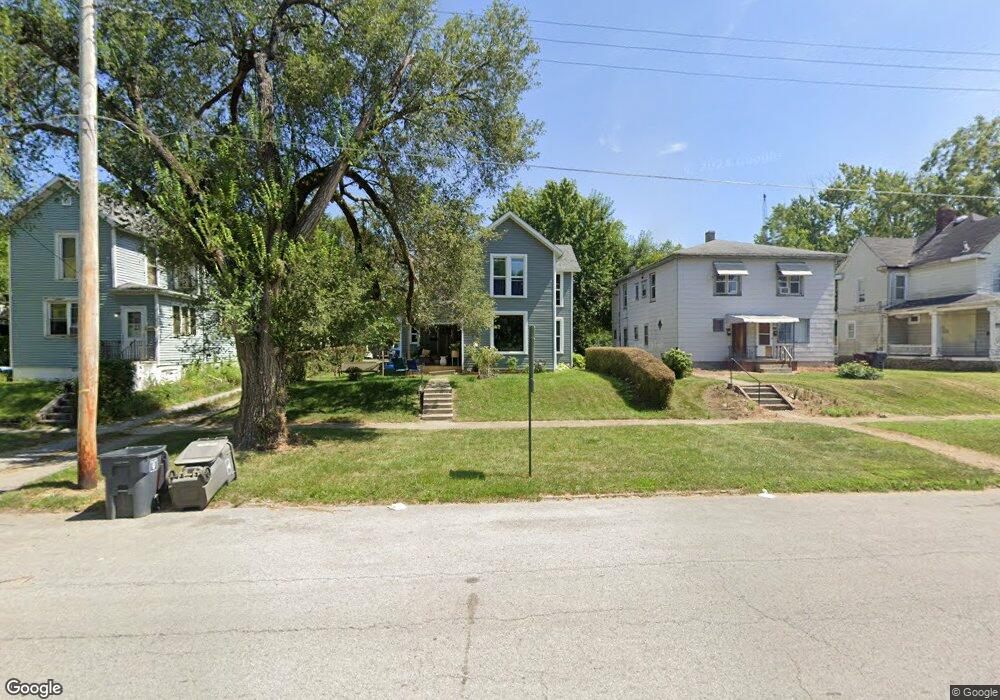
713 S Broadway St Lima, OH 45804
Fifth Ward NeighborhoodEstimated Value: $55,000 - $81,589
3
Beds
1
Bath
1,684
Sq Ft
$41/Sq Ft
Est. Value
About This Home
This home is located at 713 S Broadway St, Lima, OH 45804 and is currently estimated at $69,397, approximately $41 per square foot. 713 S Broadway St is a home located in Allen County with nearby schools including Unity Elementary School, Lima North Middle School, and Lima West Middle School.
Ownership History
Date
Name
Owned For
Owner Type
Purchase Details
Closed on
Aug 2, 2021
Sold by
Caj Rentals Ltd
Bought by
Lima 315 Llc
Current Estimated Value
Home Financials for this Owner
Home Financials are based on the most recent Mortgage that was taken out on this home.
Original Mortgage
$612,314
Outstanding Balance
$556,783
Interest Rate
2.9%
Mortgage Type
Commercial
Estimated Equity
-$487,386
Purchase Details
Closed on
Aug 23, 2002
Sold by
M & M Rentals Ltd
Bought by
Jordan Craig A
Home Financials for this Owner
Home Financials are based on the most recent Mortgage that was taken out on this home.
Original Mortgage
$237,500
Interest Rate
7%
Mortgage Type
New Conventional
Purchase Details
Closed on
Aug 18, 1999
Sold by
M & M Rentals
Bought by
Griesdorn Bernard and Griesdorn Norma
Purchase Details
Closed on
Jun 6, 1990
Bought by
Griesdorn Norma
Create a Home Valuation Report for This Property
The Home Valuation Report is an in-depth analysis detailing your home's value as well as a comparison with similar homes in the area
Home Values in the Area
Average Home Value in this Area
Purchase History
| Date | Buyer | Sale Price | Title Company |
|---|---|---|---|
| Lima 315 Llc | $294,400 | None Available | |
| Lima 315 Llc | $883 | None Listed On Document | |
| Jordan Craig A | $37,600 | -- | |
| Griesdorn Bernard | $78,000 | -- | |
| Griesdorn Norma | $8,000 | -- |
Source: Public Records
Mortgage History
| Date | Status | Borrower | Loan Amount |
|---|---|---|---|
| Open | Lima 315 Llc | $612,314 | |
| Closed | Lima 315 Llc | $612,314 | |
| Previous Owner | Jordan Craig A | $237,500 | |
| Closed | Griesdorn Bernard | $0 |
Source: Public Records
Tax History Compared to Growth
Tax History
| Year | Tax Paid | Tax Assessment Tax Assessment Total Assessment is a certain percentage of the fair market value that is determined by local assessors to be the total taxable value of land and additions on the property. | Land | Improvement |
|---|---|---|---|---|
| 2024 | $441 | $10,680 | $1,330 | $9,350 |
| 2023 | $449 | $9,520 | $1,190 | $8,330 |
| 2022 | $449 | $9,520 | $1,190 | $8,330 |
| 2021 | $474 | $9,520 | $1,190 | $8,330 |
| 2020 | $536 | $9,730 | $1,120 | $8,610 |
| 2019 | $536 | $9,730 | $1,120 | $8,610 |
| 2018 | $534 | $9,730 | $1,120 | $8,610 |
| 2017 | $538 | $9,730 | $1,120 | $8,610 |
| 2016 | $545 | $9,730 | $1,120 | $8,610 |
| 2015 | $554 | $9,730 | $1,120 | $8,610 |
| 2014 | $527 | $9,240 | $1,050 | $8,190 |
| 2013 | $514 | $9,240 | $1,050 | $8,190 |
Source: Public Records
Map
Nearby Homes
- 720 S Metcalf St
- 785 Holly St
- 711 W Kibby St
- 11 Unit Multi Family and Sfh
- 426 S Baxter St
- 306 E Vine St
- 380 S Pine St
- 419 S Collett St
- 839 Saint Johns Ave
- 705 W Elm St
- 600 Dingledine Ave
- 1147 S Union St
- 706 E Kibby St
- 1189 S Main St
- 520 Orena Ave
- 343 S Charles St
- 145 S Pine St
- 620 E Elm St Unit 1/2
- 129 S Pine St
- 516 Catalpa Ave
- 715 S Broadway St
- 331 W Kibby St
- 335 W Kibby St
- 711 S Broadway St
- 717 S Broadway St
- 327 W Kibby St
- 337 W Kibby St
- 319 W Kibby St
- 731 S Broadway St
- 731 Broadway
- 315 Kibby W 315 12
- 315 W Kibby St
- 733 S Broadway St
- 718 Greenlawn Ave
- 734 Greenlawn Ave
- 309 W Kibby St
- 736 Greenlawn Ave
- 704 S Broadway St
- 739 S Broadway St
- 712 S Broadway St