Estimated Value: $64,000 - $129,000
3
Beds
1
Bath
1,396
Sq Ft
$74/Sq Ft
Est. Value
About This Home
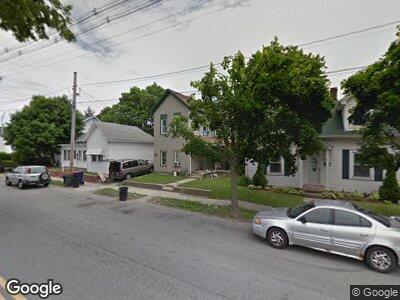
This home is located at 713 S Main St, Piqua, OH 45356 and is currently estimated at $103,220, approximately $73 per square foot. 713 S Main St is a home located in Miami County with nearby schools including Piqua Junior High School, Piqua High School, and Nicholas School.
Ownership History
Date
Name
Owned For
Owner Type
Purchase Details
Closed on
Mar 26, 2019
Sold by
Us Bank National Association
Bought by
Dejong Phyllis
Current Estimated Value
Purchase Details
Closed on
Dec 5, 2018
Sold by
Draving Linda S and Draving Ken L
Bought by
Us Bank Na and Terwin Mortgage Trust
Purchase Details
Closed on
Jan 22, 2018
Sold by
Draving Ken L
Bought by
Draving Linda S
Home Financials for this Owner
Home Financials are based on the most recent Mortgage that was taken out on this home.
Interest Rate
4.04%
Purchase Details
Closed on
Mar 4, 2005
Sold by
Draving Ken L
Bought by
Draving Ken L and Draving Linda S
Purchase Details
Closed on
Nov 29, 2004
Sold by
Walls Ronnie A
Bought by
The Bank Of New York
Purchase Details
Closed on
Feb 26, 1993
Bought by
Walls Ronnie A
Create a Home Valuation Report for This Property
The Home Valuation Report is an in-depth analysis detailing your home's value as well as a comparison with similar homes in the area
Home Values in the Area
Average Home Value in this Area
Purchase History
| Date | Buyer | Sale Price | Title Company |
|---|---|---|---|
| Dejong Phyllis | $25,500 | None Available | |
| Us Bank Na | $25,613 | None Available | |
| Draving Linda S | -- | -- | |
| Draving Ken L | -- | -- | |
| The Bank Of New York | $24,000 | -- | |
| Walls Ronnie A | $34,500 | -- |
Source: Public Records
Mortgage History
| Date | Status | Borrower | Loan Amount |
|---|---|---|---|
| Previous Owner | The Bank Of New York | -- |
Source: Public Records
Tax History Compared to Growth
Tax History
| Year | Tax Paid | Tax Assessment Tax Assessment Total Assessment is a certain percentage of the fair market value that is determined by local assessors to be the total taxable value of land and additions on the property. | Land | Improvement |
|---|---|---|---|---|
| 2024 | $459 | $20,900 | $4,730 | $16,170 |
| 2023 | $459 | $20,900 | $4,730 | $16,170 |
| 2022 | $510 | $20,900 | $4,730 | $16,170 |
| 2021 | $310 | $15,470 | $3,500 | $11,970 |
| 2020 | $713 | $15,470 | $3,500 | $11,970 |
| 2019 | $837 | $15,470 | $3,500 | $11,970 |
| 2018 | $830 | $15,120 | $3,500 | $11,620 |
| 2017 | $829 | $15,120 | $3,500 | $11,620 |
| 2016 | $737 | $15,120 | $3,500 | $11,620 |
| 2015 | $754 | $15,120 | $3,500 | $11,620 |
| 2014 | $754 | $15,120 | $3,500 | $11,620 |
| 2013 | $756 | $15,120 | $3,500 | $11,620 |
Source: Public Records
Map
Nearby Homes