713 S Randolph St Champaign, IL 61820
Clark NeighborhoodEstimated Value: $4,133,970
109
Beds
--
Bath
--
Sq Ft
1.02
Acres
About This Home
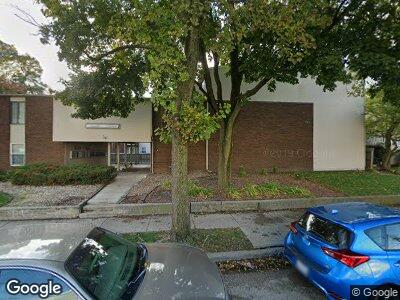
This home is located at 713 S Randolph St, Champaign, IL 61820 and is currently estimated at $4,133,970. 713 S Randolph St is a home located in Champaign County with nearby schools including Central High School and Holy Cross Elementary School.
Ownership History
Date
Name
Owned For
Owner Type
Purchase Details
Closed on
Apr 29, 2016
Sold by
Randolph Pw Llc
Bought by
Group Investments Llc
Current Estimated Value
Home Financials for this Owner
Home Financials are based on the most recent Mortgage that was taken out on this home.
Original Mortgage
$2,092,700
Interest Rate
4.62%
Mortgage Type
Future Advance Clause Open End Mortgage
Purchase Details
Closed on
Apr 18, 2016
Sold by
Mj Partners Llc
Bought by
711 Randolph Llc
Home Financials for this Owner
Home Financials are based on the most recent Mortgage that was taken out on this home.
Original Mortgage
$2,092,700
Interest Rate
4.62%
Mortgage Type
Future Advance Clause Open End Mortgage
Create a Home Valuation Report for This Property
The Home Valuation Report is an in-depth analysis detailing your home's value as well as a comparison with similar homes in the area
Home Values in the Area
Average Home Value in this Area
Purchase History
| Date | Buyer | Sale Price | Title Company |
|---|---|---|---|
| Group Investments Llc | $2,462,000 | Attorney | |
| 711 Randolph Llc | -- | Attorney | |
| Randolph Pw Llc | -- | Attorney |
Source: Public Records
Mortgage History
| Date | Status | Borrower | Loan Amount |
|---|---|---|---|
| Closed | Neves Group Investments Llc | $0 | |
| Open | Neves Group Investments Llc | $2,003,806 | |
| Closed | Group Investments Llc | $2,092,700 | |
| Previous Owner | Mj Partners Llc | $1,700,000 |
Source: Public Records
Tax History Compared to Growth
Tax History
| Year | Tax Paid | Tax Assessment Tax Assessment Total Assessment is a certain percentage of the fair market value that is determined by local assessors to be the total taxable value of land and additions on the property. | Land | Improvement |
|---|---|---|---|---|
| 2024 | $76,483 | $931,240 | $99,270 | $831,970 |
| 2023 | $76,483 | $848,120 | $90,410 | $757,710 |
| 2022 | $71,947 | $782,390 | $83,400 | $698,990 |
| 2021 | $66,244 | $723,620 | $77,130 | $646,490 |
| 2020 | $66,345 | $723,620 | $77,130 | $646,490 |
| 2019 | $64,213 | $708,730 | $75,540 | $633,190 |
| 2018 | $62,771 | $697,570 | $74,350 | $623,220 |
| 2017 | $63,032 | $697,570 | $74,350 | $623,220 |
| 2016 | $56,513 | $683,220 | $72,820 | $610,400 |
| 2015 | $56,946 | $671,140 | $71,530 | $599,610 |
| 2014 | $56,460 | $671,140 | $71,530 | $599,610 |
| 2013 | $55,952 | $671,140 | $71,530 | $599,610 |
Source: Public Records
Map
Nearby Homes
- 212 W John St
- 311 W Charles St
- 313 W Charles St
- 314 W Stanage Ave
- 506 W Green St
- 508 W Green St
- 511 W Charles St
- 200 Buena Vista Dr
- 602 Hessel Blvd
- 615 W Union St
- 805 W Charles St
- 612 W Clark St
- 707 W White St
- 706 Fairway Dr
- 301 N Neil St Unit 613
- 301 N Neil St Unit 611
- 301 N Neil St Unit 808-809
- 913 W Union St
- 408 N Prairie St Unit 9
- 503 N State St