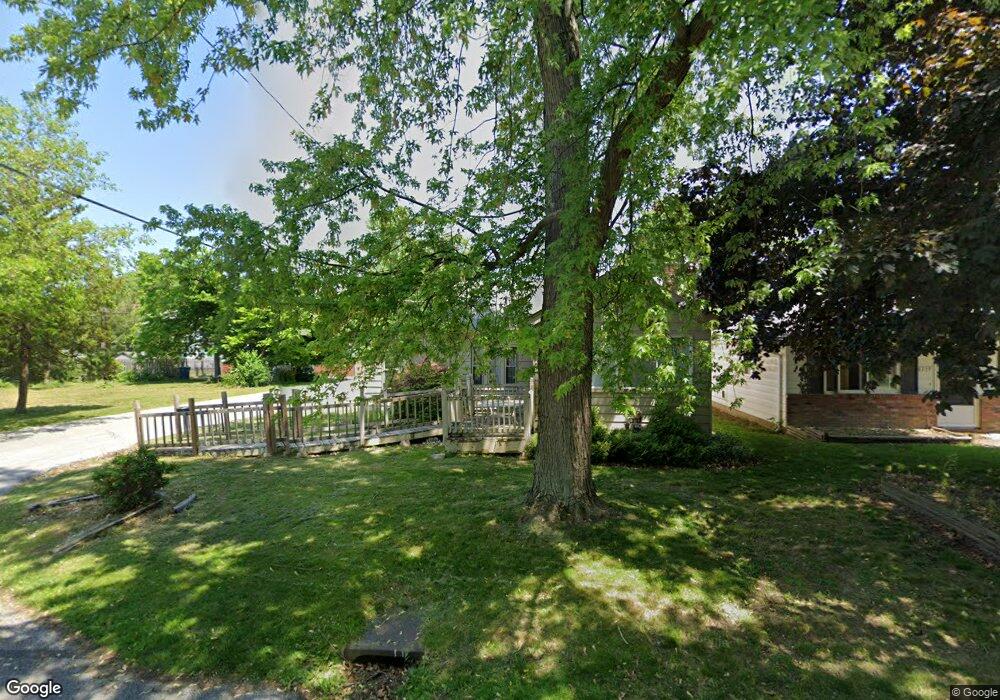
713 Tioga Trail Willoughby, OH 44094
Estimated Value: $138,000 - $165,000
3
Beds
1
Bath
1,023
Sq Ft
$152/Sq Ft
Est. Value
About This Home
This home is located at 713 Tioga Trail, Willoughby, OH 44094 and is currently estimated at $155,785, approximately $152 per square foot. 713 Tioga Trail is a home located in Lake County with nearby schools including Grant Elementary School, Willoughby Middle School, and South High School.
Ownership History
Date
Name
Owned For
Owner Type
Purchase Details
Closed on
Aug 27, 2010
Sold by
Secretary Of Housing & Urban Development
Bought by
Next Step Development Corp
Current Estimated Value
Purchase Details
Closed on
Dec 9, 2009
Sold by
National City Mortgage
Bought by
The Secretary Of Housing & Urban Develop
Purchase Details
Closed on
Nov 23, 2009
Sold by
Balante Samuel R
Bought by
National City Mortgage
Purchase Details
Closed on
May 27, 2004
Sold by
Fraunfelder Sean P and Fraunfelder Linda M
Bought by
Balante Samuel R
Home Financials for this Owner
Home Financials are based on the most recent Mortgage that was taken out on this home.
Original Mortgage
$93,532
Interest Rate
5.91%
Mortgage Type
FHA
Purchase Details
Closed on
Jan 15, 1991
Bought by
Fraunfelder Sean P
Create a Home Valuation Report for This Property
The Home Valuation Report is an in-depth analysis detailing your home's value as well as a comparison with similar homes in the area
Home Values in the Area
Average Home Value in this Area
Purchase History
| Date | Buyer | Sale Price | Title Company |
|---|---|---|---|
| Next Step Development Corp | $25,000 | None Available | |
| The Secretary Of Housing & Urban Develop | -- | Attorney | |
| National City Mortgage | $97,525 | None Available | |
| Balante Samuel R | $95,000 | -- | |
| Fraunfelder Sean P | $41,000 | -- |
Source: Public Records
Mortgage History
| Date | Status | Borrower | Loan Amount |
|---|---|---|---|
| Previous Owner | Balante Samuel R | $93,532 |
Source: Public Records
Tax History Compared to Growth
Tax History
| Year | Tax Paid | Tax Assessment Tax Assessment Total Assessment is a certain percentage of the fair market value that is determined by local assessors to be the total taxable value of land and additions on the property. | Land | Improvement |
|---|---|---|---|---|
| 2024 | -- | $39,150 | $9,280 | $29,870 |
| 2023 | $3,130 | $33,060 | $7,860 | $25,200 |
| 2022 | $2,822 | $33,060 | $7,860 | $25,200 |
| 2021 | $2,981 | $33,060 | $7,860 | $25,200 |
| 2020 | $2,294 | $27,090 | $6,440 | $20,650 |
| 2019 | $1,805 | $27,090 | $6,440 | $20,650 |
| 2018 | $1,936 | $29,970 | $9,280 | $20,690 |
| 2017 | $2,086 | $29,970 | $9,280 | $20,690 |
| 2016 | $2,079 | $29,970 | $9,280 | $20,690 |
| 2015 | $2,001 | $29,970 | $9,280 | $20,690 |
| 2014 | $1,841 | $29,000 | $9,280 | $19,720 |
| 2013 | $1,842 | $29,000 | $9,280 | $19,720 |
Source: Public Records
Map
Nearby Homes
- 700 Cherokee Trail
- 0 Birchwood Dr
- 856 Orchard Rd
- 6143 Seminole Trail
- 6335 S Cedarwood Rd
- 844 Peach Blvd
- 38514 N Beachview Rd
- 6416 Seneca Trail
- 6430 S Cedarwood Rd
- 6195 Thunderbird Dr
- 1109 Cherokee Trail
- 38407 N Beachview Rd
- 967 Windermere Dr
- 1263 Lost Nation Rd Unit 5
- 1068 Elmwood Dr
- 38598 Granite Dr Unit 31
- 38256 Lake Shore Blvd
- 7379 Larkspur Dr
- 7401 Faye Ln
- 1298 Beech St
- 719 Tioga Trail
- 723 Tioga Trail
- 712 Cherokee Trail
- 718 Cherokee Trail
- 718 Tioga Trail
- 728 Cherokee Trail
- 710 Tioga Trail
- 694 Cherokee Trail
- 735 Tioga Trail
- 689 Tioga Trail
- 734 Cherokee Trail
- 688 Cherokee Trail
- 728 Tioga Trail
- 700 Tioga Trail
- 743 Tioga Trail
- 682 Cherokee Trail
- 742 Cherokee Trail
- 677 Tioga Trail
- 730 Tioga Trail
- 676 Cherokee Trail