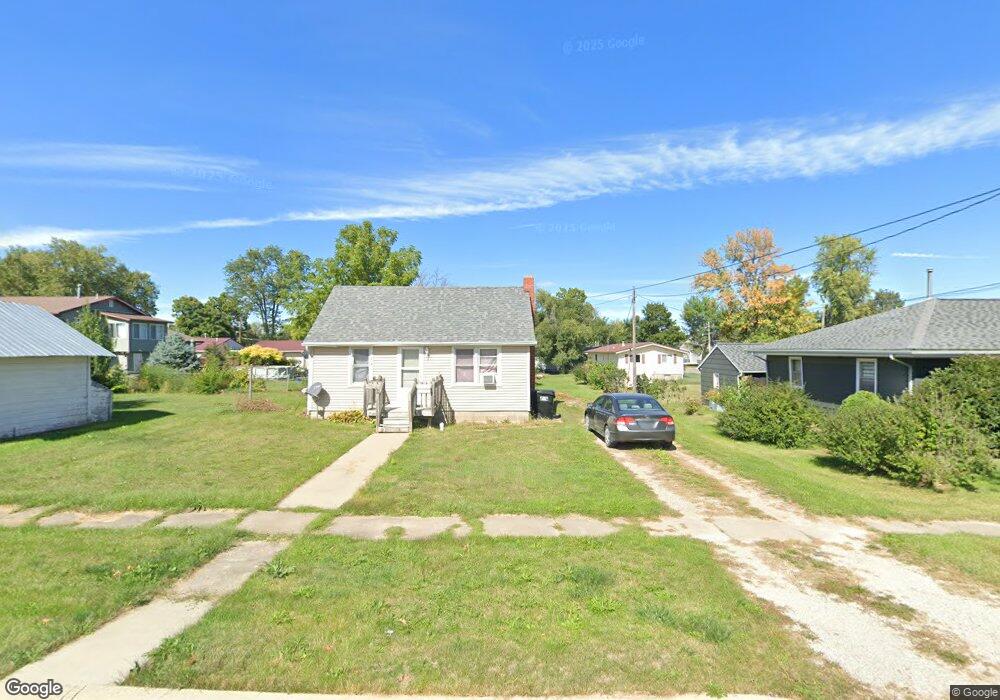
713 W 10th St Vinton, IA 52349
Estimated Value: $76,000 - $101,000
2
Beds
1
Bath
692
Sq Ft
$128/Sq Ft
Est. Value
About This Home
This home is located at 713 W 10th St, Vinton, IA 52349 and is currently estimated at $88,463, approximately $127 per square foot. 713 W 10th St is a home located in Benton County with nearby schools including Tilford Elementary School, Shellsburg Elementary School, and Vinton-Shellsburg Middle School.
Ownership History
Date
Name
Owned For
Owner Type
Purchase Details
Closed on
Aug 5, 2021
Sold by
Lindsey Terry L
Bought by
Zeneli Eriton
Current Estimated Value
Home Financials for this Owner
Home Financials are based on the most recent Mortgage that was taken out on this home.
Original Mortgage
$43,493
Interest Rate
2.9%
Mortgage Type
New Conventional
Purchase Details
Closed on
Jul 13, 2010
Sold by
Duncklee Blane T
Bought by
Lindsey Terry L and Lindsey Virginia
Home Financials for this Owner
Home Financials are based on the most recent Mortgage that was taken out on this home.
Original Mortgage
$54,200
Interest Rate
4.74%
Mortgage Type
Future Advance Clause Open End Mortgage
Create a Home Valuation Report for This Property
The Home Valuation Report is an in-depth analysis detailing your home's value as well as a comparison with similar homes in the area
Home Values in the Area
Average Home Value in this Area
Purchase History
| Date | Buyer | Sale Price | Title Company |
|---|---|---|---|
| Zeneli Eriton | $58,000 | None Available | |
| Lindsey Terry L | $45,450 | None Available |
Source: Public Records
Mortgage History
| Date | Status | Borrower | Loan Amount |
|---|---|---|---|
| Closed | Zeneli Eriton | $43,493 | |
| Previous Owner | Lindsey Terry L | $54,200 |
Source: Public Records
Tax History Compared to Growth
Tax History
| Year | Tax Paid | Tax Assessment Tax Assessment Total Assessment is a certain percentage of the fair market value that is determined by local assessors to be the total taxable value of land and additions on the property. | Land | Improvement |
|---|---|---|---|---|
| 2025 | $1,490 | $86,000 | $16,000 | $70,000 |
| 2024 | $1,490 | $79,500 | $15,300 | $64,200 |
| 2023 | $1,398 | $79,500 | $15,300 | $64,200 |
| 2022 | $1,436 | $65,000 | $12,200 | $52,800 |
| 2021 | $1,436 | $65,000 | $12,200 | $52,800 |
| 2020 | $1,032 | $47,700 | $10,900 | $36,800 |
| 2019 | $1,032 | $47,700 | $10,900 | $36,800 |
| 2018 | $1,002 | $47,100 | $10,200 | $36,900 |
| 2017 | $910 | $47,100 | $10,200 | $36,900 |
| 2016 | $896 | $41,500 | $9,500 | $32,000 |
| 2015 | $896 | $41,500 | $9,500 | $32,000 |
| 2014 | $954 | $44,100 | $0 | $0 |
Source: Public Records
Map
Nearby Homes