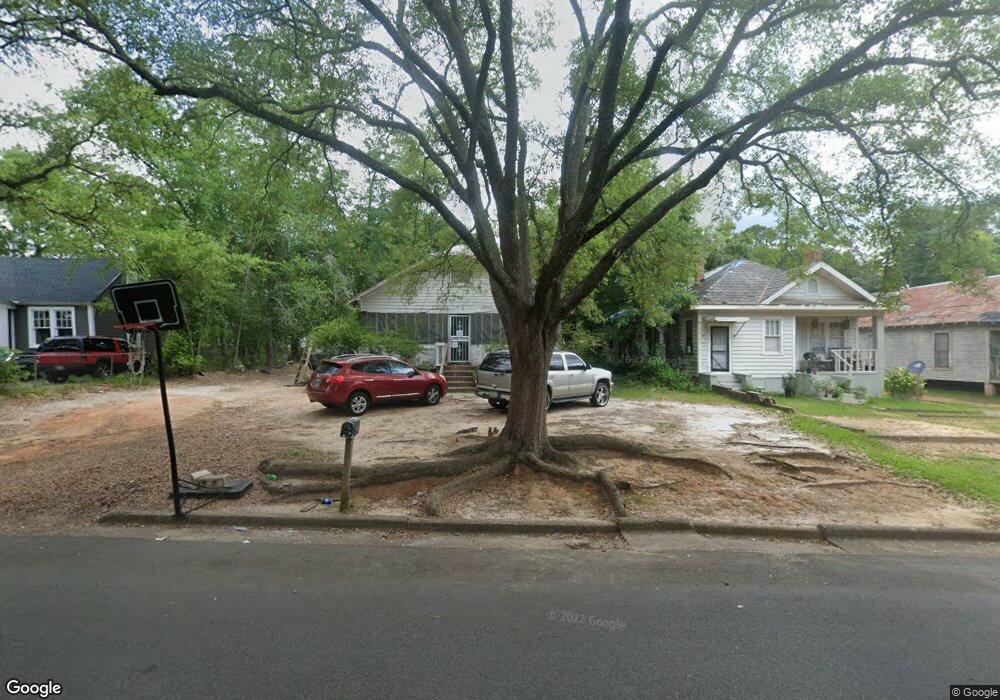
713 W 1st Ave Albany, GA 31701
Estimated Value: $64,000 - $93,000
4
Beds
2
Baths
1,456
Sq Ft
$51/Sq Ft
Est. Value
About This Home
This home is located at 713 W 1st Ave, Albany, GA 31701 and is currently estimated at $74,879, approximately $51 per square foot. 713 W 1st Ave is a home located in Dougherty County with nearby schools including Northside Elementary School, Albany Middle School, and Albany High School.
Ownership History
Date
Name
Owned For
Owner Type
Purchase Details
Closed on
Sep 17, 2014
Sold by
Alexius Nyoka
Bought by
Watson Edward W and Watson Felicia M
Current Estimated Value
Home Financials for this Owner
Home Financials are based on the most recent Mortgage that was taken out on this home.
Original Mortgage
$10,000
Interest Rate
4.15%
Mortgage Type
New Conventional
Purchase Details
Closed on
Aug 15, 2014
Sold by
Taylor Angelique B
Bought by
Alexius Nyoka
Home Financials for this Owner
Home Financials are based on the most recent Mortgage that was taken out on this home.
Original Mortgage
$10,000
Interest Rate
4.15%
Mortgage Type
New Conventional
Purchase Details
Closed on
Mar 5, 2010
Sold by
Alexius Nyoka
Bought by
Taylor Angelique B
Purchase Details
Closed on
Jun 18, 2002
Sold by
Shelton James M and Shelton Joyce S
Bought by
Alexius Nyoka
Purchase Details
Closed on
Dec 30, 1983
Sold by
Griffin Douglas E
Bought by
Griffin D
Create a Home Valuation Report for This Property
The Home Valuation Report is an in-depth analysis detailing your home's value as well as a comparison with similar homes in the area
Home Values in the Area
Average Home Value in this Area
Purchase History
| Date | Buyer | Sale Price | Title Company |
|---|---|---|---|
| Watson Edward W | $10,000 | -- | |
| Alexius Nyoka | -- | -- | |
| Taylor Angelique B | -- | -- | |
| Alexius Nyoka | $35,000 | -- | |
| Griffin D | -- | -- |
Source: Public Records
Mortgage History
| Date | Status | Borrower | Loan Amount |
|---|---|---|---|
| Closed | Watson Edward W | $10,000 |
Source: Public Records
Tax History Compared to Growth
Tax History
| Year | Tax Paid | Tax Assessment Tax Assessment Total Assessment is a certain percentage of the fair market value that is determined by local assessors to be the total taxable value of land and additions on the property. | Land | Improvement |
|---|---|---|---|---|
| 2024 | $538 | $11,280 | $4,360 | $6,920 |
| 2023 | $526 | $11,280 | $4,360 | $6,920 |
| 2022 | $527 | $11,280 | $4,360 | $6,920 |
| 2021 | $489 | $11,280 | $4,360 | $6,920 |
| 2020 | $490 | $11,280 | $4,360 | $6,920 |
| 2019 | $492 | $11,280 | $4,360 | $6,920 |
| 2018 | $494 | $11,280 | $4,360 | $6,920 |
| 2017 | $460 | $11,280 | $4,360 | $6,920 |
| 2016 | $461 | $11,280 | $4,360 | $6,920 |
| 2015 | $164 | $11,280 | $4,360 | $6,920 |
| 2014 | $367 | $9,080 | $2,160 | $6,920 |
Source: Public Records
Map
Nearby Homes
- 720 W 2nd Ave
- 711 W 2nd Ave
- 701 N Van Buren St
- 631 W 3rd Ave
- 1200 N Mckinley St
- 902 W 2nd Ave
- 1107 N Davis St
- 908 Rosedale Ave
- 908 W 2nd Ave
- 913 Rosedale Ave
- 911 W Society Ave
- 912 NW Rodesale
- 804 W Residence Ave
- 810 W Residence Ave
- 509 N Harding St
- 911 W 3rd Ave
- 903 W Residence Ave
- 1201 Rawson Dr
- 907 W Residence Ave
- 921 W 3rd Ave