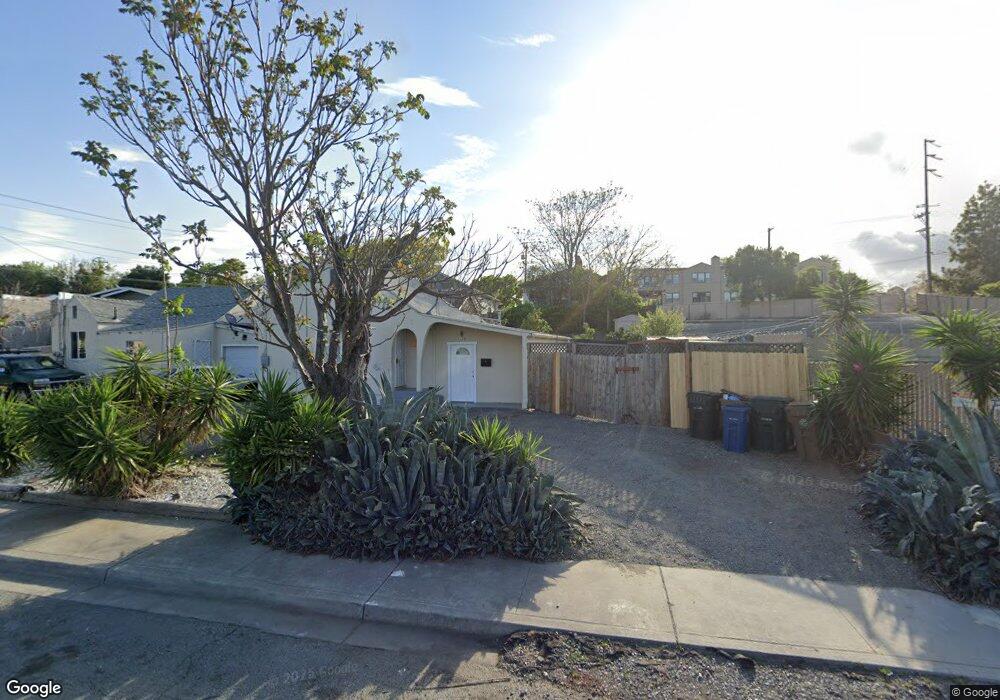
713 W 6th St Antioch, CA 94509
North Antioch NeighborhoodEstimated Value: $395,000 - $440,017
2
Beds
2
Baths
770
Sq Ft
$542/Sq Ft
Est. Value
About This Home
This home is located at 713 W 6th St, Antioch, CA 94509 and is currently estimated at $417,509, approximately $542 per square foot. 713 W 6th St is a home located in Contra Costa County with nearby schools including Fremont Elementary School, Antioch Middle School, and Antioch High School.
Ownership History
Date
Name
Owned For
Owner Type
Purchase Details
Closed on
Jan 17, 2006
Sold by
Marall Charles P and Marall Susan E
Bought by
Marall Charles P and Marall Susan Elizabeth
Current Estimated Value
Purchase Details
Closed on
Nov 8, 1996
Sold by
Ulloa and Elvira
Bought by
Marall Charles
Purchase Details
Closed on
Oct 26, 1993
Sold by
Marall Charles
Bought by
Ulloa Silverio and Ulloa Elvira
Create a Home Valuation Report for This Property
The Home Valuation Report is an in-depth analysis detailing your home's value as well as a comparison with similar homes in the area
Home Values in the Area
Average Home Value in this Area
Purchase History
| Date | Buyer | Sale Price | Title Company |
|---|---|---|---|
| Marall Charles P | -- | None Available | |
| Marall Charles P | -- | None Available | |
| Marall Charles | -- | Financial Title Company | |
| Ulloa Silverio | $105,000 | Financial Title Company | |
| Marall Charles | -- | Financial Title Company |
Source: Public Records
Mortgage History
| Date | Status | Borrower | Loan Amount |
|---|---|---|---|
| Closed | Ulloa Silverio | $0 |
Source: Public Records
Tax History Compared to Growth
Tax History
| Year | Tax Paid | Tax Assessment Tax Assessment Total Assessment is a certain percentage of the fair market value that is determined by local assessors to be the total taxable value of land and additions on the property. | Land | Improvement |
|---|---|---|---|---|
| 2025 | $2,549 | $138,405 | $65,132 | $73,273 |
| 2024 | $2,464 | $135,692 | $63,855 | $71,837 |
| 2023 | $2,464 | $133,032 | $62,603 | $70,429 |
| 2022 | $2,438 | $130,425 | $61,376 | $69,049 |
| 2021 | $2,342 | $127,869 | $60,173 | $67,696 |
| 2019 | $2,259 | $124,078 | $58,389 | $65,689 |
| 2018 | $2,177 | $121,646 | $57,245 | $64,401 |
| 2017 | $2,105 | $119,262 | $56,123 | $63,139 |
| 2016 | $2,031 | $116,924 | $55,023 | $61,901 |
| 2015 | $1,986 | $115,169 | $54,197 | $60,972 |
| 2014 | $1,914 | $112,914 | $53,136 | $59,778 |
Source: Public Records
Map
Nearby Homes