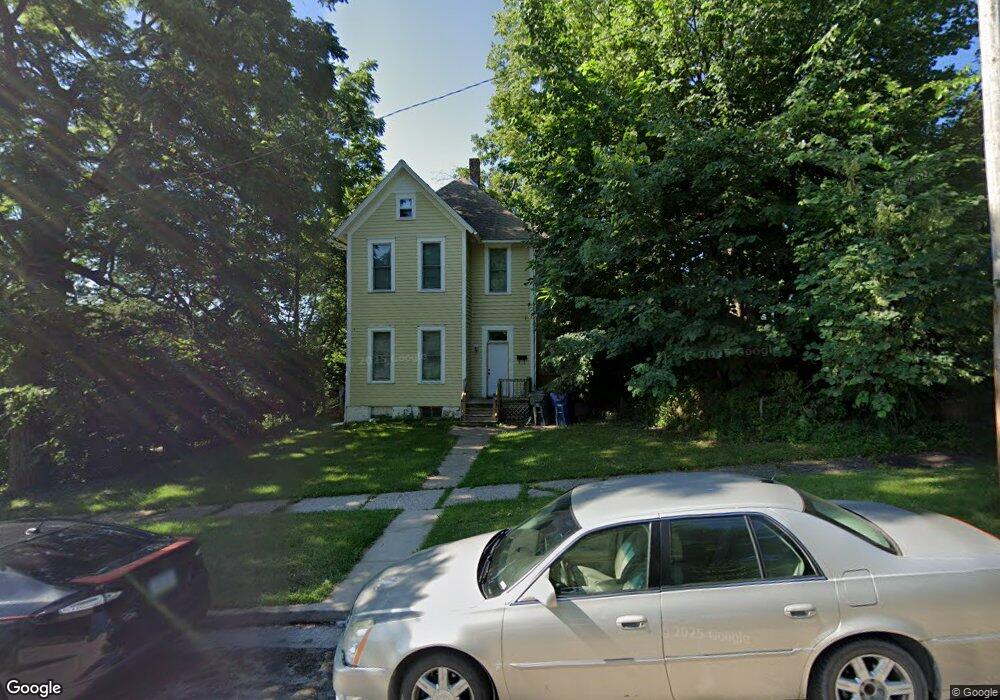
713 W 7th St Davenport, IA 52802
Central Davenport NeighborhoodEstimated Value: $70,000 - $117,000
3
Beds
2
Baths
1,606
Sq Ft
$61/Sq Ft
Est. Value
About This Home
This home is located at 713 W 7th St, Davenport, IA 52802 and is currently estimated at $97,291, approximately $60 per square foot. 713 W 7th St is a home located in Scott County with nearby schools including Walnut Hill Elementary School, Christian County Middle School, and Casey County Middle School.
Ownership History
Date
Name
Owned For
Owner Type
Purchase Details
Closed on
Jul 27, 2021
Sold by
Erenberger Joseph and Erenberger Lydia
Bought by
Ame Holdings Llc
Current Estimated Value
Purchase Details
Closed on
Aug 31, 2020
Sold by
Estate Of Michele E Socia
Bought by
Erenberger Joseph and Erenberger Lydia
Home Financials for this Owner
Home Financials are based on the most recent Mortgage that was taken out on this home.
Original Mortgage
$66,000
Interest Rate
2.9%
Mortgage Type
New Conventional
Purchase Details
Closed on
Apr 24, 2010
Sold by
Stephens Mark A and Stephens Kathleen
Bought by
Socia Michele
Create a Home Valuation Report for This Property
The Home Valuation Report is an in-depth analysis detailing your home's value as well as a comparison with similar homes in the area
Home Values in the Area
Average Home Value in this Area
Purchase History
| Date | Buyer | Sale Price | Title Company |
|---|---|---|---|
| Ame Holdings Llc | -- | None Listed On Document | |
| Erenberger Joseph | $31,000 | None Available | |
| Socia Michele | $30,000 | None Available |
Source: Public Records
Mortgage History
| Date | Status | Borrower | Loan Amount |
|---|---|---|---|
| Previous Owner | Erenberger Joseph | $66,000 |
Source: Public Records
Tax History Compared to Growth
Tax History
| Year | Tax Paid | Tax Assessment Tax Assessment Total Assessment is a certain percentage of the fair market value that is determined by local assessors to be the total taxable value of land and additions on the property. | Land | Improvement |
|---|---|---|---|---|
| 2025 | $1,278 | $87,760 | $16,070 | $71,690 |
| 2024 | $1,248 | $71,530 | $16,070 | $55,460 |
| 2023 | $966 | $71,530 | $16,070 | $55,460 |
| 2022 | $1,078 | $45,250 | $6,430 | $38,820 |
| 2021 | $954 | $44,420 | $6,430 | $37,990 |
| 2020 | $1,352 | $38,690 | $6,430 | $32,260 |
| 2019 | $725 | $38,690 | $6,430 | $32,260 |
| 2018 | $1,206 | $38,690 | $6,430 | $32,260 |
| 2017 | $1,593 | $38,690 | $6,430 | $32,260 |
| 2016 | $911 | $38,690 | $0 | $0 |
| 2015 | $681 | $51,240 | $0 | $0 |
| 2014 | $944 | $51,240 | $0 | $0 |
| 2013 | $924 | $0 | $0 | $0 |
| 2012 | -- | $54,690 | $8,410 | $46,280 |
Source: Public Records
Map
Nearby Homes