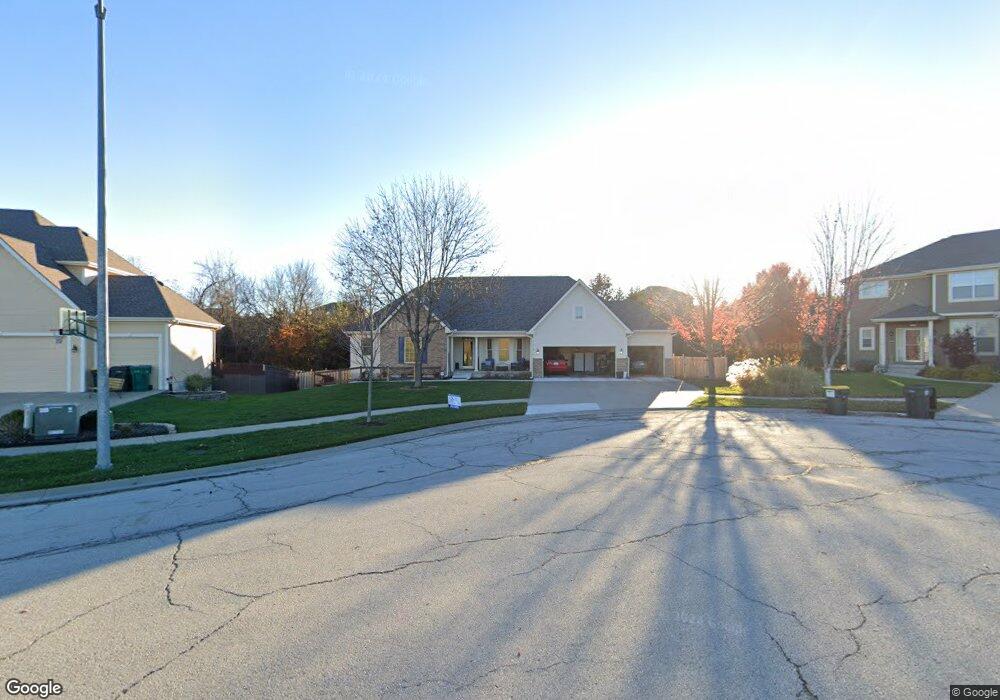
713 Willow St Lansing, KS 66043
Estimated Value: $481,000 - $572,805
4
Beds
4
Baths
2,462
Sq Ft
$208/Sq Ft
Est. Value
About This Home
This home is located at 713 Willow St, Lansing, KS 66043 and is currently estimated at $511,701, approximately $207 per square foot. 713 Willow St is a home located in Leavenworth County with nearby schools including Lansing Elementary School, Lansing Middle 6-8, and Lansing High 9-12.
Ownership History
Date
Name
Owned For
Owner Type
Purchase Details
Closed on
Apr 1, 2005
Bought by
Rotkoff Steven W and Rotkoff Eleanor K
Current Estimated Value
Home Financials for this Owner
Home Financials are based on the most recent Mortgage that was taken out on this home.
Original Mortgage
$314,100
Interest Rate
5.58%
Mortgage Type
New Conventional
Create a Home Valuation Report for This Property
The Home Valuation Report is an in-depth analysis detailing your home's value as well as a comparison with similar homes in the area
Home Values in the Area
Average Home Value in this Area
Purchase History
| Date | Buyer | Sale Price | Title Company |
|---|---|---|---|
| Rotkoff Steven W | $59,500 | -- |
Source: Public Records
Mortgage History
| Date | Status | Borrower | Loan Amount |
|---|---|---|---|
| Closed | Rotkoff Steven W | $314,100 | |
| Closed | Rotkoff Steven W | $348,183 |
Source: Public Records
Tax History Compared to Growth
Tax History
| Year | Tax Paid | Tax Assessment Tax Assessment Total Assessment is a certain percentage of the fair market value that is determined by local assessors to be the total taxable value of land and additions on the property. | Land | Improvement |
|---|---|---|---|---|
| 2025 | $8,530 | $65,038 | $6,081 | $58,957 |
| 2024 | $8,193 | $62,537 | $6,081 | $56,456 |
| 2023 | $8,193 | $62,537 | $6,081 | $56,456 |
| 2022 | $7,894 | $56,971 | $5,153 | $51,818 |
| 2021 | $7,610 | $52,612 | $5,153 | $47,459 |
| 2020 | $7,365 | $50,107 | $5,153 | $44,954 |
| 2019 | $7,375 | $50,107 | $5,153 | $44,954 |
| 2018 | $7,086 | $48,179 | $5,153 | $43,026 |
| 2017 | $6,894 | $46,776 | $5,153 | $41,623 |
| 2016 | $6,897 | $46,776 | $5,153 | $41,623 |
| 2015 | $6,877 | $46,776 | $5,153 | $41,623 |
| 2014 | $6,600 | $45,835 | $5,153 | $40,682 |
Source: Public Records
Map
Nearby Homes
- 866 Clearview Dr
- 875 Clearview Dr
- 1221 S Desoto Rd
- 1322 Rock Creek Ct
- 833 Rock Creek Dr
- 811 4-H Rd
- 922 Southfork St
- 000 4-H Rd
- 527 S Valley Dr
- 104 Olive St
- 24431 139th St
- 13965 Mc Intyre Rd
- 13788 McIntyre1 Rd
- 13788 Mcintyre Rd
- 13788 McIntyre2 Rd
- 522 Forestglen Ln
- 202 S Main St
- 124 S Main St
- 20958 Ida St
- 546 Hithergreen Dr